


JPMorgan says bitcoin’s brief move back above $85,000 could give miners some much-needed relief, and that the bank treats this level as a “soft floor.” Verdict first, because the headline is doing the wrong kind of work. $85,000 is not a wall. It is an average — an average over a fleet that keeps changing — and calling it a “soft floor” is a polite way of admitting it does not hold by itself. A floor that only works when the market stays above it is not a floor. It is a description.
Here is what the number actually is. Bitcoin spent a staggering 280 days below its average production cost before finally poking above it during that week’s rally, then slipped right back under, trading near $84,000. That comes from JPMorgan, in U.Today’s writeup of the note. The bank’s reasoning, from the analysts led by Panigirtzoglou, is that inefficient operators may be forced to sell more reserves when price sits below cost, and that above the line there is more room to breathe. That is the entire claim. It is weaker than the headline wrapped around it.
Is $85,000 a Floor, or Just an Average?
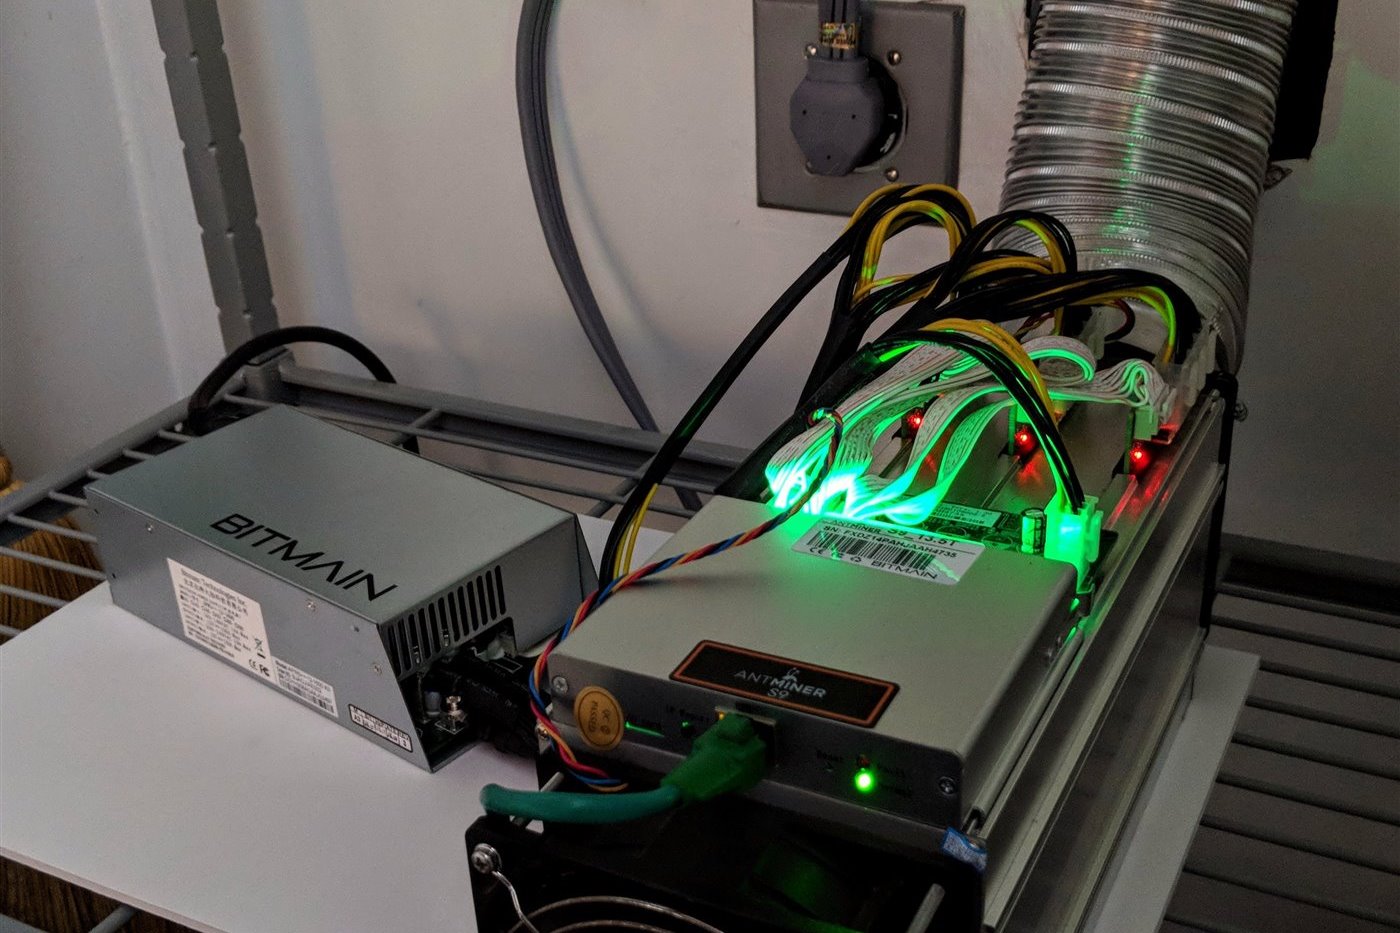
Before we argue about whether the level holds, be honest about what it measures. A production cost is an accounting output, not a physical constant. It is the cost to mine one bitcoin across some set of machines, at some power price, at some network difficulty — and every one of those inputs moves. The fleet changes every month as new ASICs ship and old ones get unplugged. Power contracts get renegotiated. And difficulty retargets to total hashrate, which is itself a moving average of who is still mining.
So the “$85,000 production cost” is not the cost of the network. It is closer to the cost of the marginal operator, averaged against a mixed fleet that no single person controls. It is not a price level the market “respects” — it is a number that the network’s composition quietly redraws underneath you. Swap in a batch of newer machines and the line drops. Unplug the inefficient tail and the line moves again. That is the tell. A real floor would not care which hardware is plugged in.
This is a derived average. It is descriptive, not causal. It tells you, roughly, where the industry’s cost centre sat over a window. It does not tell you that price must stop there, the way a support level on a chart supposedly tells you buyers will appear. Derive a statistic from the same data and then treat it as a law of nature, and you have confused a summary with a constraint.
What Does 280 Days Below Cost Actually Tell You?
Now the interesting part. 280 days below average production cost, and the industry did not stop. Hashrate did not go to zero. Miners with cheap power, newer machines, or hedged energy kept running because their own cost per coin was below the “average” — and the operators who could not, sold reserves or shut rigs off. The average is not a survival line. It is an average. By construction, a large part of the fleet sits below it.
JPMorgan says as much if you read past the headline. The bank cautions that a temporary move above production cost will not change the economics of mining overnight. Bitcoin would need to stay around or above the threshold long enough for miners to feel material improvement. The line is not a switch. It is a slow-moving backdrop against which individual operators make individual decisions.
I have seen too many teams do exactly this — take a reported average, treat it as a hard constraint, and build a whole thesis on the assumption that the world will respect it. It never does. The average is where the crowd is; the survivors are the ones whose own cost sits somewhere else.
“Historically, Bitcoin miners often monetize part of their production during strong markets to cover significant operating and capital expenses.”
— CryptoQuant analysts, via U.Today

Why Did 20,000 BTC Hit an Exchange and Nothing Break?
Now look at the tape, because the tape is where the value is. CryptoQuant data shows miner inflows to Binance surged to 19,866 BTC on September 21 — the largest spike since August 25, when more than 25,000 BTC moved to exchanges. Nearly twenty thousand coins hit one venue in a day. And bitcoin held around $85,400.
That resilience is the actual story, and the explanation is boring. Miners selling into strength is normal business. It is what gold producers do. The fiat proceeds cover operating and capital expenses — power bills, new machines, debt service. Nothing about the behaviour changed. What changed is the market’s reaction function.
“This behavior is broadly comparable to that of gold producers, who often sell part of their production when prices are stronger.”
— CryptoQuant analysts, via U.Today
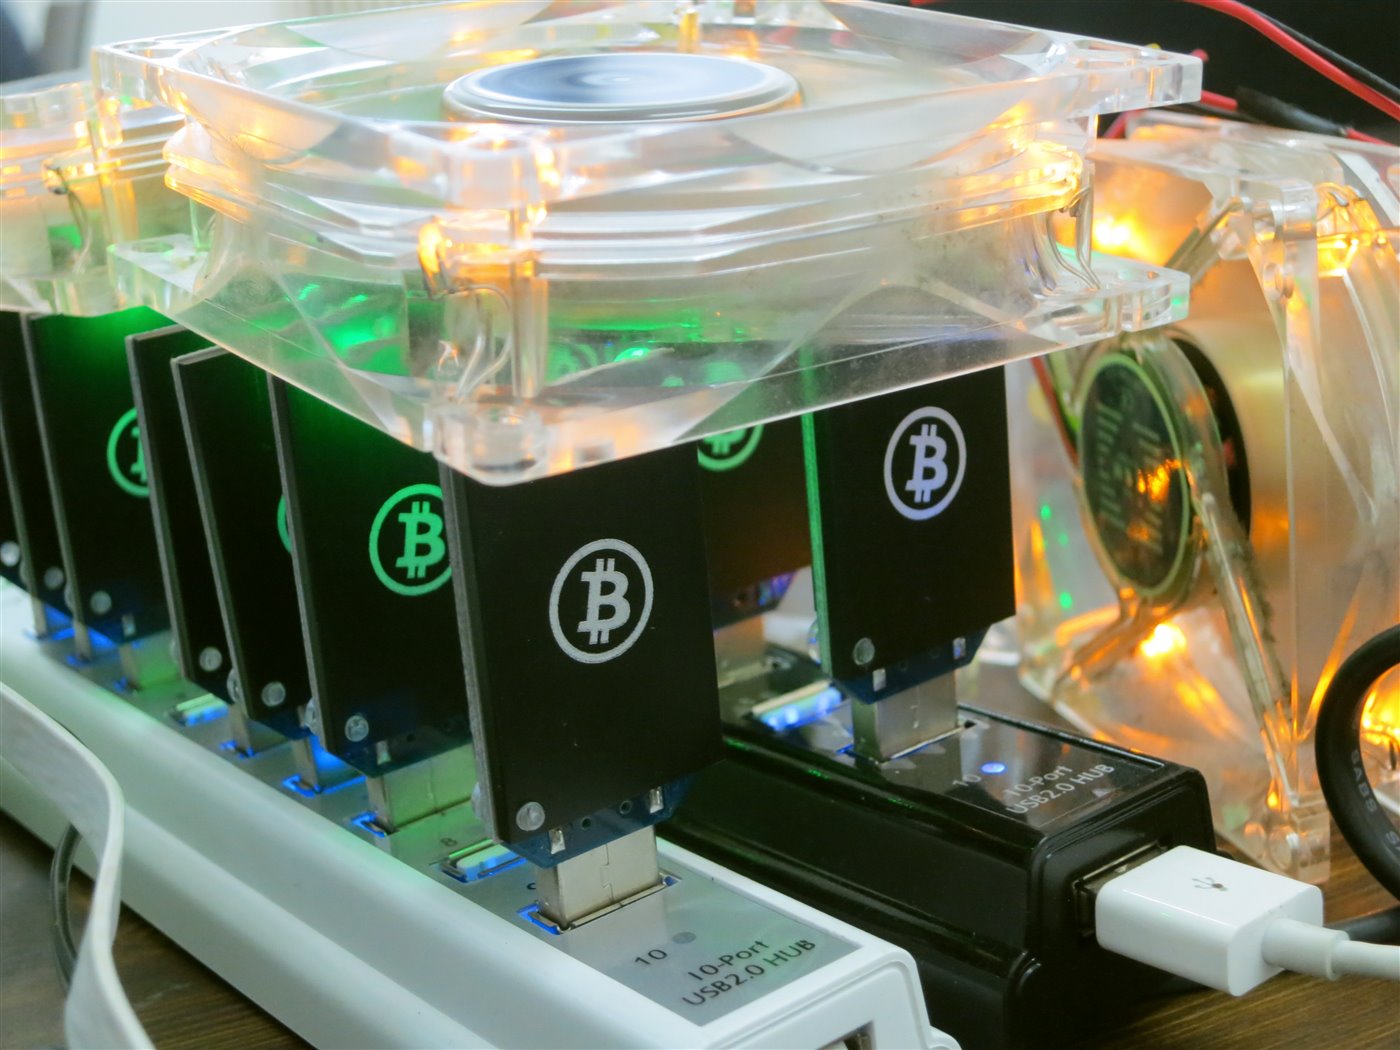
CryptoQuant’s own framing is that the market used to fall on miner inflows, and now it does not. Large deposits near 20,000 BTC no longer trigger the immediate drops seen in earlier cycles. That should make you suspicious of the old rule, not confident in a new one. A signal that stops working is usually a signal that was never causal. Miner outflow was always a symptom of price, not a cause of it. When price is strong enough to sell into, you see selling — and the cause is the strength, not the coins moving.
What Would Actually Change the Math?
Be concrete. A spike above cost changes nothing. Sustained time above cost — weeks, not a day — is what would let miners rebuild margins and refinance. Cheaper energy would lower the cost line directly. Newer, more efficient machines would do the same for whoever buys them, and would push the line up for whoever is still running the old ones. These are the levers that move the number, and none of them are pulled by the market crossing a line for a few hours.
The market’s own state matters too, and right now it is cautious. Futures open interest stood at 652,000 BTC, one of its lowest levels this year, against a peak of 800,000 early in the year, per Coinglass. Perpetual funding rates flipped negative, averaging about minus 0.3% across major exchanges — meaning shorts are the ones paying to stay short. Add a dollar index above 101, the 10-year Treasury yield above 5.2%, the 30-year above 5.51%, and gold slipping about 3% in a day to around $4,150 an ounce, and the tape looks like money leaving risk. Bitcoin was trading near $82,800, down more than 2% in 24 hours, as CoinDesk reported — yet still more than $20,000 above its summer cycle low and still the best-performing asset of the third quarter, up roughly 40%.
So where does that leave us? The honest boundary: the production-cost figure is an estimate. We have no per-fleet cost data in front of us here — not the power contracts, not the machine mix, not the debt schedules. We have one bank’s number and one week above it, and a single week above a line is not a trend. I am not telling you the floor holds or that it fails. I am telling you it is an average that keeps moving, and that anyone quoting it as a wall has not told you what it actually measures. Watch the time spent above cost, not the crossing. That is the only part of this that means anything.


