
Conclusion first: on 1 October 2026 the altcoin season index published by CoinMarketCap read 61 out of 100, its highest level since January, and on the same day the median altcoin traded roughly 79 percent below its cycle peak. Both numbers come from real markets and neither is wrong. They are not in conflict, because they do not measure the same thing: one counts how many tokens beat bitcoin over a recent window, and the other counts what the tokens are worth.
Almost every argument about an altseason is an argument about which of those two objects the word refers to. The trading is real, the attention is real, and the capital has not moved. That sentence is the whole article, and the rest of it is the evidence, taken one layer at a time.
What the index counts, and how three providers get three answers
The altcoin season index is a breadth measure. On the CoinMarketCap construction it asks what share of the top 100 assets have outperformed bitcoin over the past 90 days, scaled to 100; a reading above 75 is the usual confirmation that an altseason is under way. It read 38 in early April, spent parts of September between 45 and 53, and reached 61 on 1 October.
Now compare providers. Blockchain Center’s version of the same idea read 41 on 20 September. Glassnode’s altcoin cycle signal, which tracks the top 250 with a different method, crossed its own 75 threshold at 81.25 on 22 September before easing back. Three readings, one market, spread wide enough that any claim of the form “the index says X” is really a claim about the index’s list and window. Breadth measures tell you about participation. They do not tell you about size, and size is where the money is.
The size numbers are quieter and more useful. Bitcoin dominance was 59.34 percent on 20 September and about 58.6 percent on 1 October, so it eased without breaking. Altcoin market capitalisation reached about $1.19 trillion on 22 September, the highest since late January and 33 percent above 19 August, inside a total crypto market of roughly $2.86 trillion. That is a real expansion, financed by a market that was itself rising, which is the first hint that the flows and the gains are not the same thing.
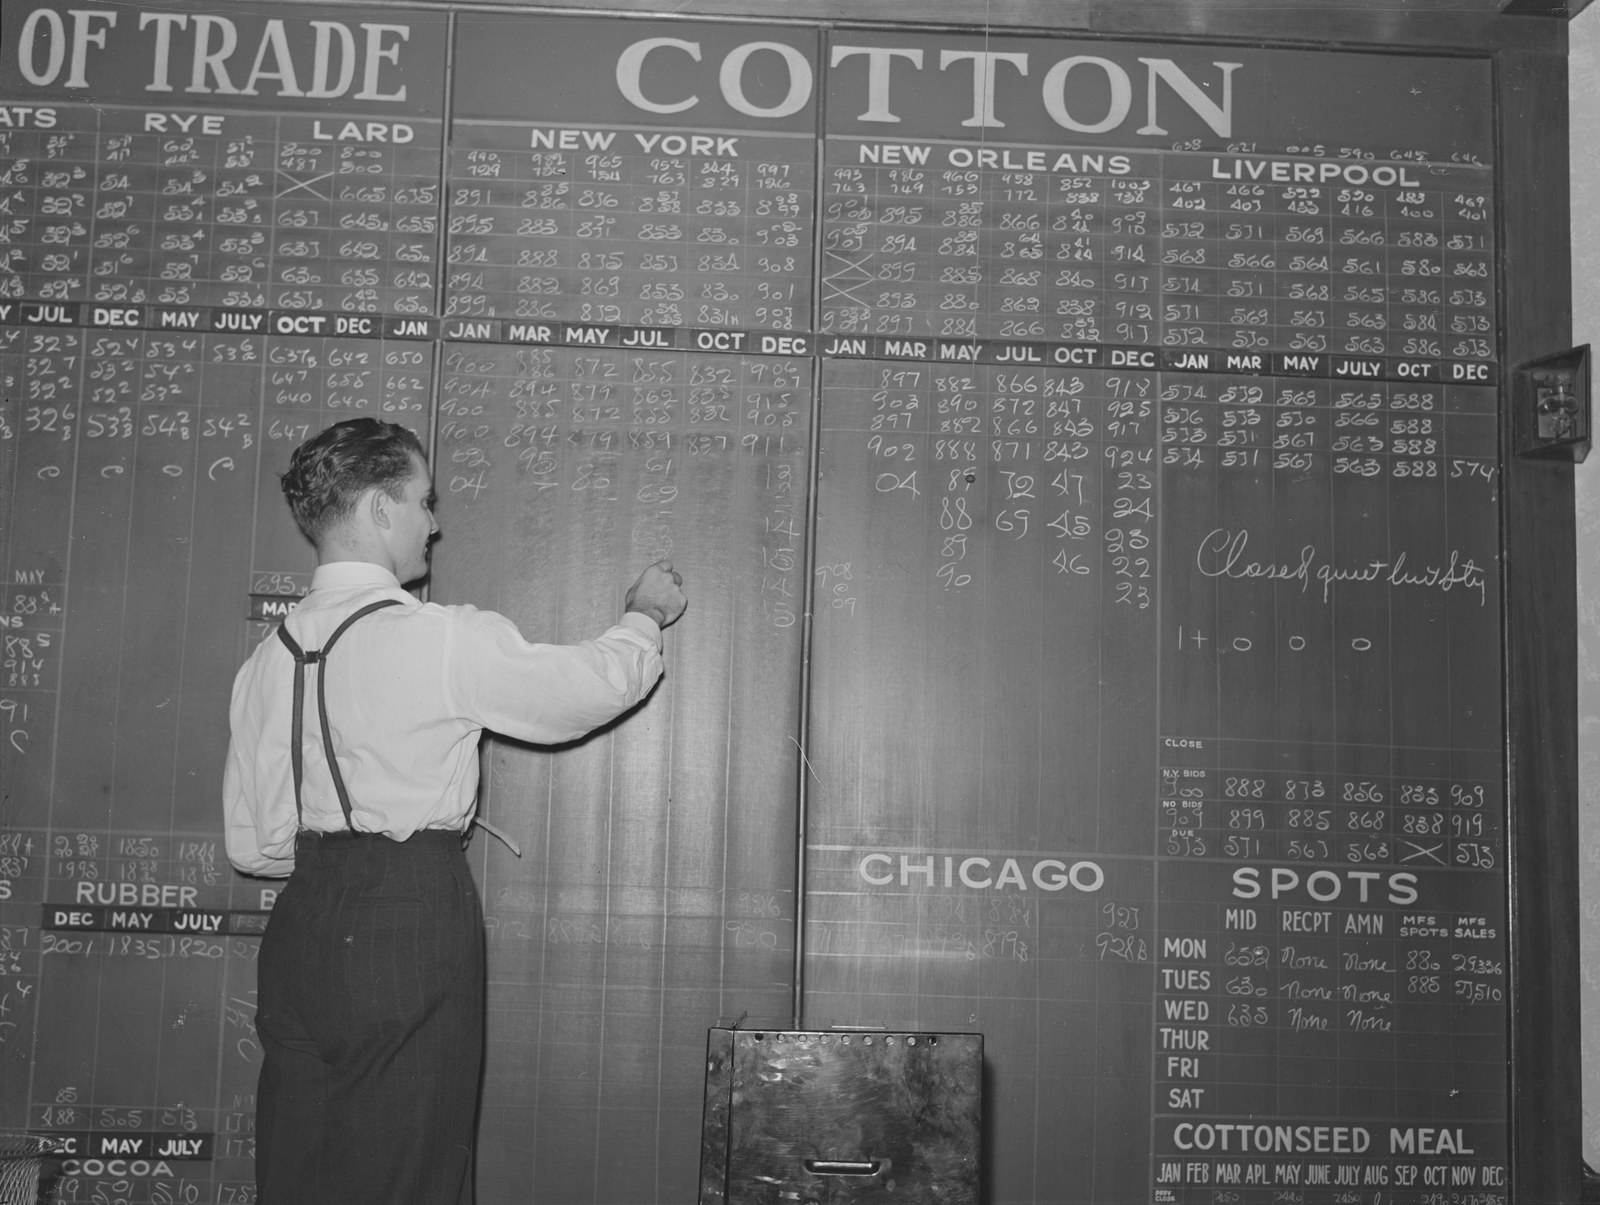
Volume rotated. Market capitalisation share did not.
Glassnode reported that altcoin spot trading volume had climbed to nearly four times bitcoin’s spot volume, the highest ratio since September 2025. That is a large, measurable change in behaviour, and it is being read as rotation. Read it as three separate things instead.
First, it is turnover, not net capital. A dollar that trades five times in a week is counted five times and adds a dollar of capital, and high-turnover regimes inflate volume ratios without moving ownership. Second, the same firm noted that altcoins’ share of total market capitalisation had fallen 0.9 percentage points over the previous 90 days, where the last four bitcoin tops saw that share rise about 2.8 percentage points. Third, altcoin perpetual open interest measured in coins barely grew over 30 days, which is why Glassnode called the move predominantly spot-driven. In February 2021 and December 2024 the same ratio moved with leverage behind it; this time the leverage is not in the picture.
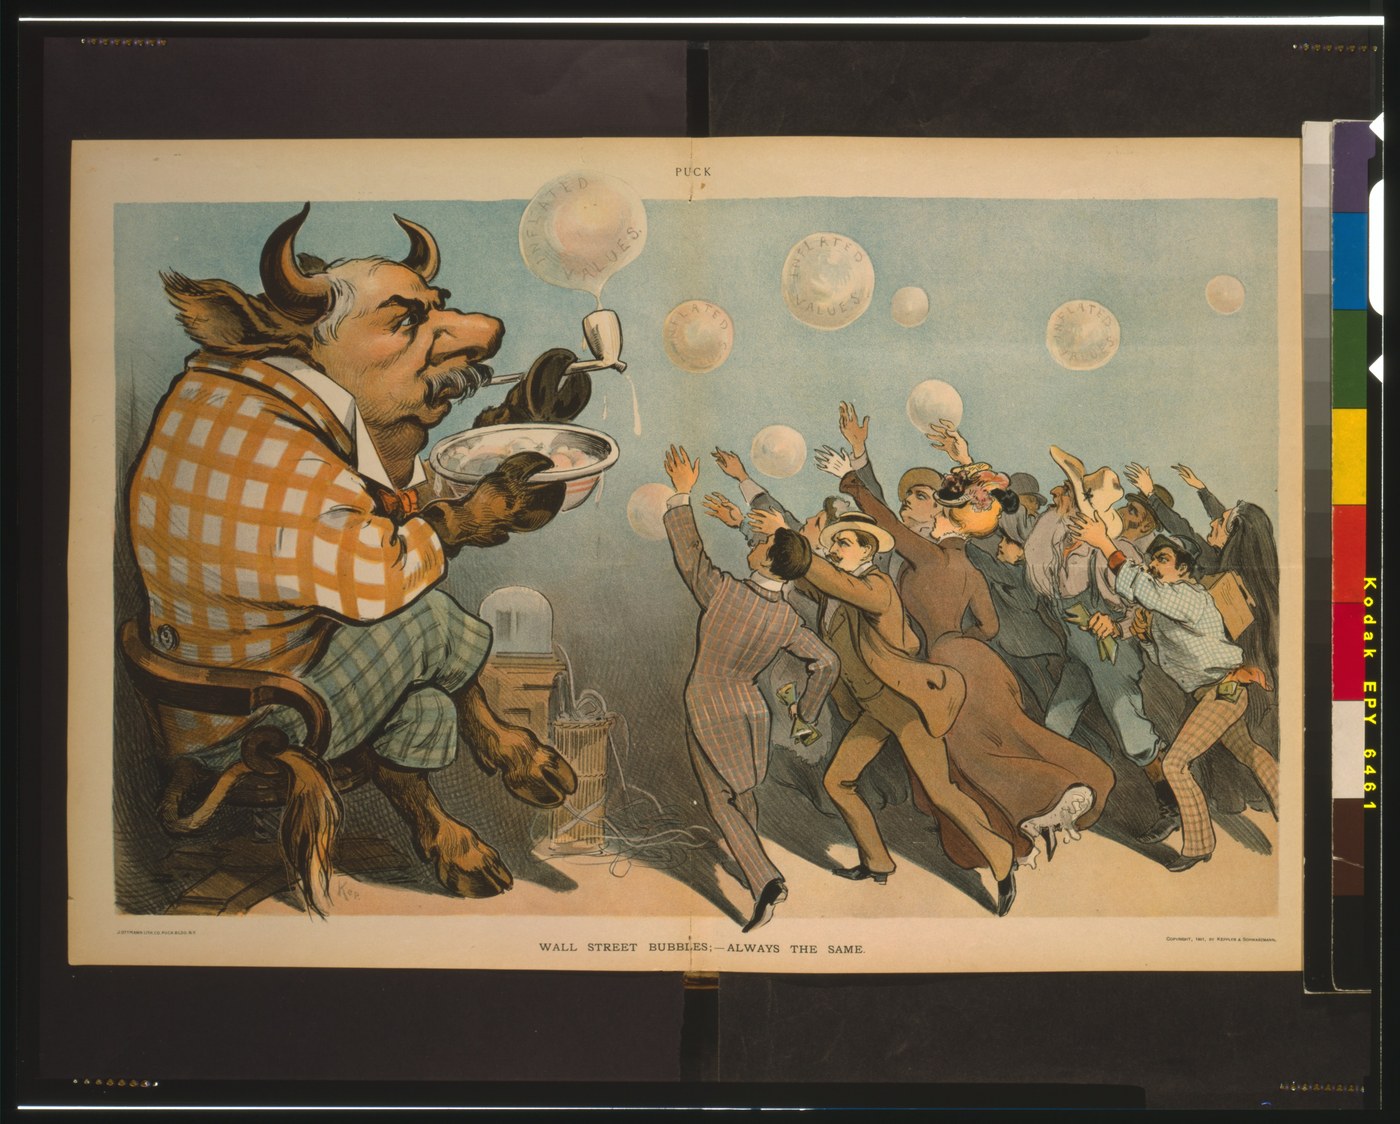
The median token is 79 percent below its peak, and 38 percent are near all-time lows
Breadth and size are both flattering compared with what happened to the average token. Published readings in late 2026 put about 38 percent of altcoins near all-time lows, a worse figure than the aftermath of FTX, with the median altcoin roughly 79 percent below its cycle peak. Over the prior two years, bitcoin gained about 28 percent while the median mid-cap altcoin return fell about 74 percent and ether was roughly flat; only 36 of the top 100 altcoins showed a profit for holders at one September snapshot.
Arca’s chief investment officer, Jeff Dorman, measured the same thing from the 13 October 2025 peak: 39 of the top 50 assets were still down more than 50 percent, bitcoin was down 30.69 percent, ether 39.95 percent and solana 48.19 percent, and only eight of the 50 had exceeded their previous October highs.
So a breadth index at 61 and a median token at minus 79 percent can coexist, and the reason is concentration. The gains live in a small set of names, and breadth counts the names that beat bitcoin on a window, however small the gains. That is why the index is a thermometer that measures the number of warm objects rather than the temperature of the room.
Quant is what this rotation looks like inside one token
The clearest case is Quant. On 24 September, The Clearing House — the US bank consortium that clears and settles more than $2 trillion a day — selected Quant to provide the interoperability, orchestration and transaction-management layer for its on-chain money initiative, the tokenized-deposit network announced in June and targeted for availability in the first half of 2027. QNT moved from about $56 to $74, then to roughly $373, its highest since September 2021 and about 13 percent below its all-time high of $427.42, before settling back into the $241 to $253 range.
The on-chain record of that week is unusually detailed, and it is worth reading in the order the activity happened. Santiment recorded 645 transactions of $100,000 or more on the Quant network in a single day, its highest reading on that chart. New addresses reached 7,516 on 27 September, against a weekday average of roughly 351 during the first half of the month and 351 on the announcement day itself. Active addresses went from 2,064 on 24 September to 14,458 on 27 September, and dollar-denominated open interest rose about nine times over four days.
Then the direction of the large holders. Addresses that had been dormant for more than three years moved QNT onto exchanges after the rally: one deposited 8,250 QNT, about $1.88 million, to Binance, and another moved 34,200 QNT, about $8.05 million, of which 9,000 QNT worth roughly $2.12 million went to Coinbase and Kraken. A wallet linked to Quant’s founder, idle for seven years, sent 25,776 QNT, about $6.97 million, to new wallets while still holding 600,000 QNT, about $160.39 million. The total from the two dormant addresses alone was about 42,400 QNT, roughly $9.93 million. Santiment’s own caution belongs next to the headline: whale activity confirms that large players are watching, and it does not say whether any given whale is buying or selling.
There is also a gap between the announcement and the token. The Clearing House agreement covers software and infrastructure for interbank settlement; the participating banks, including 25 of the largest US institutions, do not have to buy QNT on an open market to use it. So the on-chain record of that week is a record of attention arriving and of old supply leaving, while the price record is a record of a narrative being repriced. Long liquidations of about $430,000 inside one hour are the small print.
Chainlink shows concentration, which is not the same as inflow
The second pattern is quieter. Santiment logged 246 Chainlink transactions of $100,000 or more in a single day in mid-August 2026, the highest daily count in five months, while wallets holding between 100,000 and 10 million LINK controlled 466.31 million LINK, or 46.57 percent of supply, and the number of wallets above 100,000 LINK reached an all-time high of 805. CCIP, the protocol’s cross-chain layer, has processed more than $18 billion in transfer volume.
Every number there is about who holds the token and how much of it moves, and none of them is a measure of new money entering the asset. Concentration can rise while price falls, because a large holder buying from a medium holder changes the distribution without changing the float. Usage of a protocol is also not demand for its token, which is a distinction worth keeping in a market where both facts are reported as bullish.
The three readings that would separate rotation from noise
Nothing above says altcoins cannot rally. It says the word rotation is doing too much work, and it can be replaced by three specific measurements. The first is altcoins’ share of total crypto market capitalisation, which fell 0.9 percentage points over the last 90 days measured. The second is altcoin perpetual open interest denominated in coins rather than dollars, which was roughly flat over 30 days; the dollar version of that series rises automatically when price rises, which is why it looks like a build-up. The third is the median token’s distance from its cycle peak, which is about 79 percent.
A genuine rotation turns all three at once, because it moves ownership, leverage and the middle of the distribution. What is happening now moves the trading mix and the top of the distribution, and leaves the middle where it has been since last October. One analyst made the point from the other end: Benjamin Cowen argued that bitcoin’s 2025 top came from apathy rather than euphoria, which is why the usual rotation into altcoins never started.
What the difference is worth
Strip the label off and the market has a clear shape. Trading volume and attention moved down the risk curve while ownership did not, and a handful of tokens with a real institutional story repriced violently and were met by old supply. That is a harder market than an altseason, not an easier one: in a broad rotation, holding the index works. In this one, the index contains the 38 percent of tokens near their lows and the returns sit in names you had to pick.
For a trader, the practical consequence is that a breadth reading of 61 is not a buy signal for the category. For an allocator, it is the opposite kind of signal: the assets that are absorbing institutional announcements are identifiable one at a time, and the ones that are not have been falling for a year. Both of those are facts about selection rather than about season.


