


Market capitalisation is the most quoted number in this market and the least examined. The formula is a multiplication: a price, which is published by exchanges and observable in real time, and a quantity of tokens, which is supplied by somebody. Everything that can go wrong with the number goes wrong in the second term, and the second term is not a market observation at all. It is a definition, and different data providers, exchanges and project teams use different ones.
The consequence is that two sites can report different sizes for the same asset on the same day without either being wrong, and that a ranking of assets by this number is a ranking produced by an editorial decision as much as by trading. For a reader the practical response is not to distrust the metric but to learn what it is a function of, because used correctly it says something real about scale and about future supply pressure, and used carelessly it says something false about value.
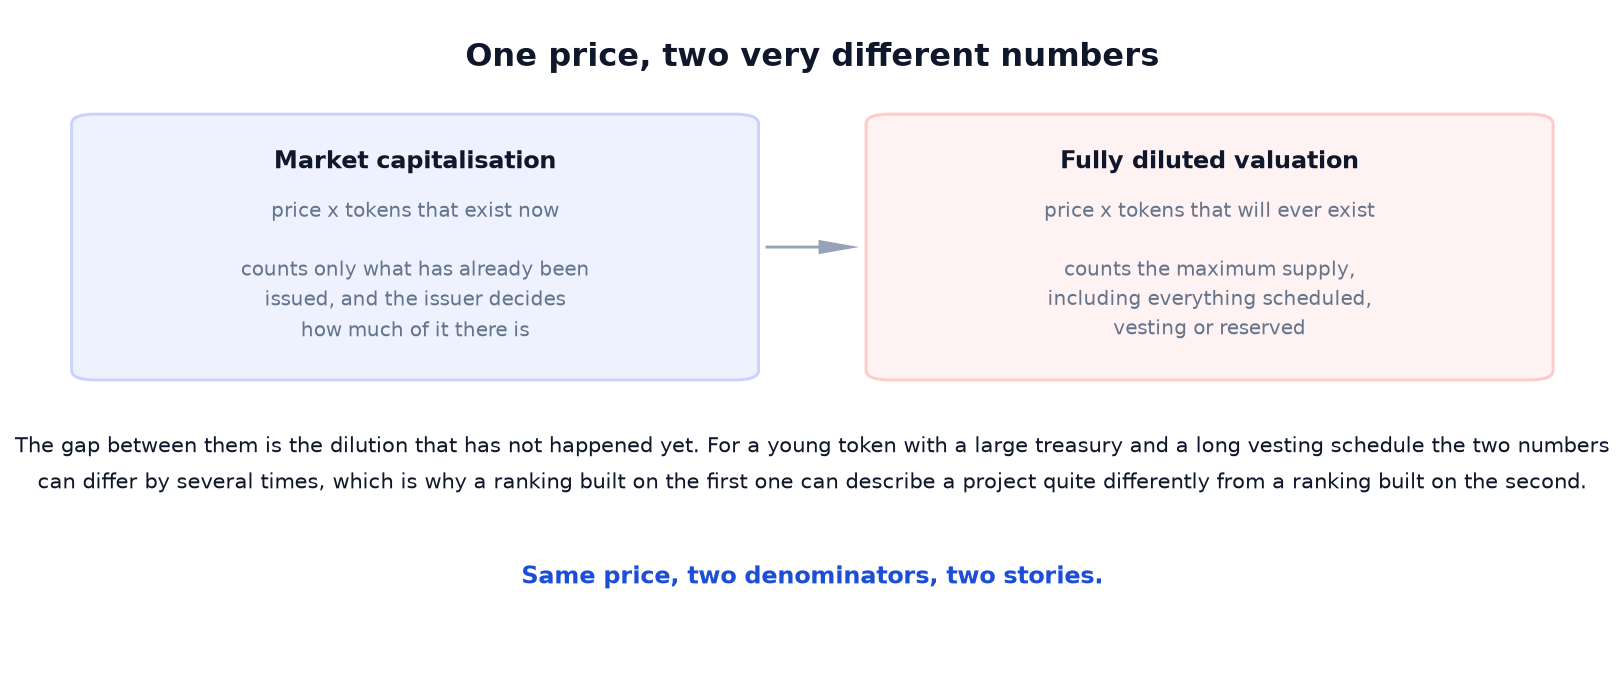
The formula, and where the uncertainty lives
The price is the easy term. It is the last trade, or a composite of the last trades across several venues, and while the choice of venue changes the figure at the margin it does not change the story. The quantity is harder. A token has tokens that exist now, tokens that are locked in a contract but already created, tokens that a protocol is entitled to create later, and tokens whose creation is capped by a rule. Each of those is a defensible denominator and each produces a different number.
That is why the same asset can be described as having a market value of one billion or three billion with equal confidence, and why the difference is usually explained away as a data error rather than as a definitional choice. It is not an error. It is a choice, made by whoever compiled the figure, about what counts.
Three denominators, three numbers
Multiply the price by the tokens that have been issued and are available to trade and the result is what most rankings call market capitalisation. Multiply it by every token that exists, including those locked by a team or a foundation, and the result is sometimes called total supply market cap. Multiply it by the maximum that the rules allow to exist, and the result is fully diluted valuation.
The three numbers are ordered, and the ordering is what makes the set useful. For a mature asset with a fixed supply and no locked allocations, they converge and the distinction is academic. For a young token with a large reserve and a long vesting schedule, they can differ by several times, and the third figure is the one that describes what the market would be paying if everything promised were already circulating.
The gap between the first and the third is a measure of dilution ahead. That is a fact about the asset’s structure rather than about its price, and it is published in the project’s documentation, which is why a reader who wants it can usually get it in a few minutes.
Who actually decides what circulates
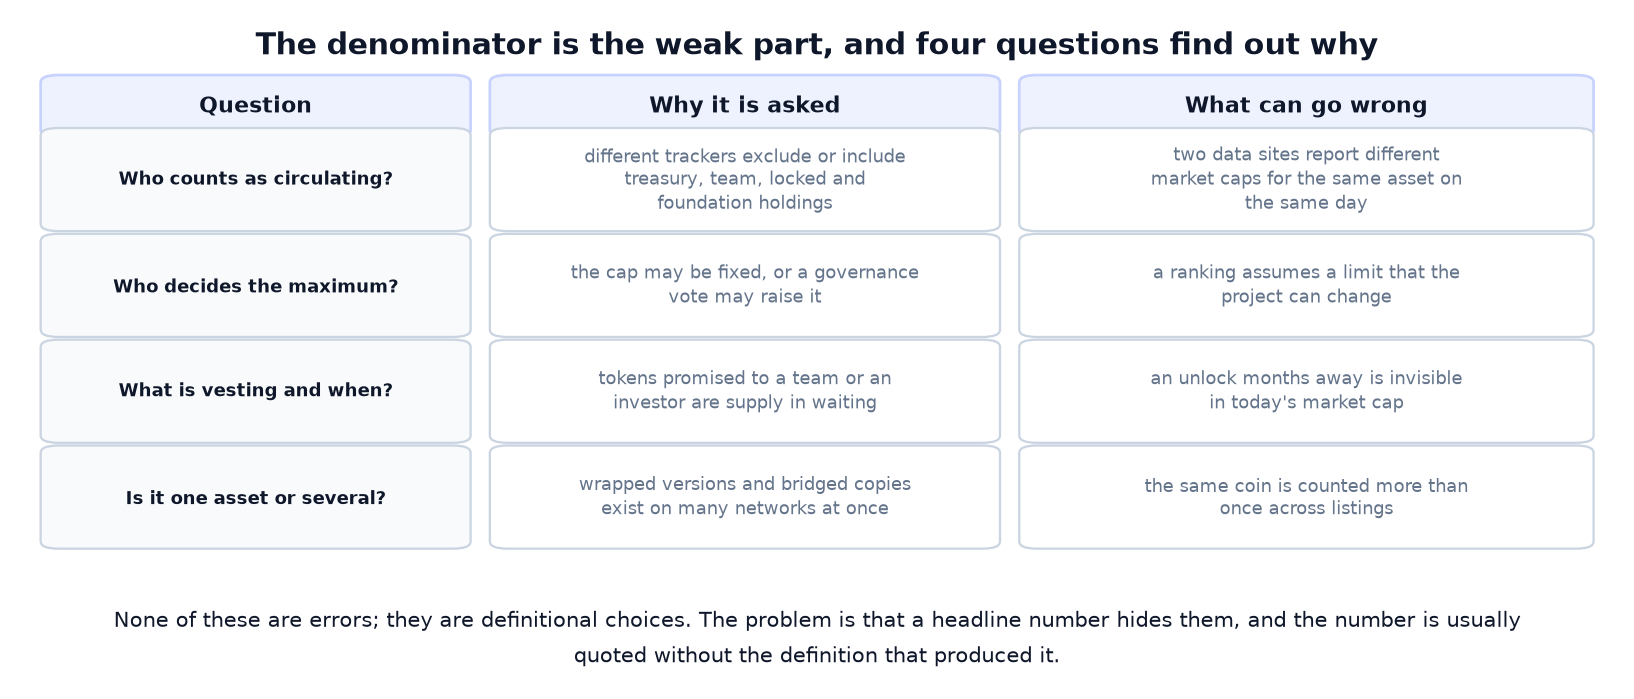
The circulating quantity is compiled by data providers, and the compilation rules vary in ways that matter. Treasury holdings may be excluded or included. Tokens held by the founding entity may be counted as circulating if they are in addresses the provider does not recognise as related. Tokens locked in a contract with a known unlock date may be excluded even though they exist. Wrapped versions of the same asset on other networks may be counted once or twice.
Projects also publish their own figures, which may disagree with the aggregators, and the disagreement is not always the project’s fault: a provider that mislabels a treasury address produces a number that is wrong in the direction of making the asset look smaller. The practical consequence is familiar from any dataset assembled by third parties. The number is approximately right about the magnitude and unreliable about the details, and the details are what rankings are sorted by.
The unlock schedule is the shape of the future
For a token issued with a vesting plan, the supply calendar is the most concrete fact available about it. The plan states how many tokens will become transferable on which dates, and those dates are published because the recipients of the allocations are institutions that report them. A reader who has the calendar has a schedule of supply increases that no other information in the market can match for precision.
The market treats those dates as events, and the reaction is usually to price them in advance. What the calendar cannot say is what the recipients will do. A vested allocation held by a long-term fund is not the same as one held by an early buyer whose fund is expiring, and the same unlock can pass with a small dip or trigger a sustained decline depending on facts the calendar does not contain.
The ratio is what makes the calendar legible. A token whose fully diluted valuation is three times its market capitalisation has two thirds of itself still to arrive, and the schedule over which it arrives determines the pace of dilution. A token with a ratio near one has almost nothing left to unlock, which is a different risk profile from the same market capitalisation with a large reserve waiting.
What market capitalisation is not
It is not the amount of money that has been invested. A market capitalisation of one billion dollars does not mean that a billion dollars entered the asset; it means that the last traded price, multiplied by a quantity, equals a billion. Money that entered earlier at lower prices is not in the number, and money that left is not subtracted from it.
It is not the cost of acquiring the network. Buying an entire float would move the price against the buyer long before the purchase was complete, because the supply available to buy at any moment is a small fraction of the supply that exists. The gap between what a token is worth on paper and what could be realised in cash is the subject of the next section.
And it is not a measure of value in the way the same words describe a company. A company’s equity has earnings behind it, or assets, or a claim on future cash flows. A network token has none of those things by construction, and comparing the two figures as though they were the same quantity is the origin of a large share of the arguments about whether a token is expensive.
The liquidity illusion
The decisive difference between a market capitalisation and a realisable value is depth. In a market with deep liquidity, selling a position of a few million dollars moves the price slightly. In a market with thin liquidity, the same sale can move it several percent, and the attempt to sell the entire float would collapse the price to something unrecognisable.
This is where the ranking misleads most severely for the smallest assets, and it misleads in both directions. A token near the top of a ranking by this measure is usually deep enough to trade seriously, which makes the number roughly meaningful as a scale. A token far down the ranking may have a market capitalisation that corresponds to a daily volume that would not cover a house, and the number is a description of a price rather than of a market.
The check takes one comparison: the quoted market value against the daily traded volume and against the depth available within a few percent of the current price. Where those two are far apart, the larger figure is a statement about the last trade rather than about anything that could be executed.
The metric as an index input
Because the number is easy to compute and universally reported, it has become the weighting scheme for indices and for funds that track them. That is a defensible design, and it has two properties worth knowing. Weighting by market capitalisation means weighting by price, so an asset that doubles rises to a larger share of the index without anything about it changing except its price. And weighted indices concentrate: the largest few assets can account for most of the index, which means a product described as a broad exposure may be a concentrated one.
The same logic applies to the total market value of the category, which is a sum of numbers that were compiled with different definitions by different providers. Adding them is arithmetic on incommensurable quantities, and the total is best read as an indicator of the direction of prices rather than as the size of anything in particular.
Where the number is genuinely useful
Three uses survive the criticism. The first is scale: a comparison between assets in the same maturity class is informative about which one has more capital behind it, in the same way that comparing the size of two companies is informative even when neither is profitable. The second is the ratio to fully diluted valuation, which describes dilution ahead and is a fact about structure rather than about price.
The third is as the denominator for flow figures. A net inflow of a hundred million dollars means something different to an asset of one billion and to an asset of a hundred billion, and the market value is the only convenient scale on which to express it. That use is the one most relevant to readers of fund flow reporting, and it is also the one where the definitional wobble in the denominator matters least.
One category where the number means something else entirely
Stablecoins break the metric rather than strain it. A dollar token’s supply is the size of a liability rather than a market value: it is the amount of dollars that somebody has promised to pay on demand, and it does not move with a price. Comparing a stablecoin’s supply with a volatile asset’s market capitalisation mixes a quantity of promises with a quantity of priced claims, and the resulting chart is a category error drawn as a line.
The same caution applies to tokens that represent a claim on another asset, to liquid staking receipts and to wrapped versions. Each has a supply that exists because of an underlying position, and counting them alongside free-floating assets inflates the total without adding information.
Three checks that take ten minutes
Three questions turn the number from a headline into a fact. What is the denominator, and who compiled it? A figure that comes with its definition is worth ten that do not. What is the maximum, and is it fixed? A supply cap written into the protocol is a different promise from one that a vote can raise.
And what is the schedule for what has not been issued yet, which is the question that connects today’s figure to the dilution ahead. The answers are in the documentation, in the unlock dashboards and in the difference between the first and third denominators, and none of them requires trusting any of the aggregators.
Supply, float and what can actually be traded
The circulating figure is a count of tokens that are not formally locked, which is not the same as the number available to buy. A large share of the circulating supply normally sits with long-term holders, with treasury operations, with market makers who hold inventory, and with funds whose mandate prevents them from selling quickly. What remains is the float, and the float is what moves the price.
The distinction explains a pattern that confuses people who compare an asset’s market value with the daily volume in it. Two networks with identical market capitalisations can have entirely different tradable supplies, and the one with the thinner float will move further on the same amount of news. A rise of several percent on a modest purchase is not evidence of enthusiasm; it is arithmetic on a small float.
It also explains the criticism aimed at the structure in which a small fraction of a token trades while a large portion waits to arrive. The complaint is not that the supply exists; it is that a market capitalisation computed on the small circulating portion describes the asset as though the remaining supply were already distributed and priced. The float behind the number is what makes the number comparable between assets or not.
Three ways the same figure gets computed
In practice a reader will encounter three versions of the same quantity. A project’s own dashboard usually reports a figure based on the maximum allowed supply, which is the most conservative valuation and the least flattering. An aggregator reports a figure based on what it believes circulates, with rules about treasury and foundation holdings that vary by provider. An exchange’s listing page often reports whatever the listing agreement specified, which may be neither.
The differences are not large for a mature asset and can exceed a factor of two for a new one, and the direction of the disagreement is informative. When an aggregator’s figure exceeds a project’s own, the likely cause is that some addresses the project counts as restricted are not recognised as such from outside. When it is smaller, the likely cause is that the aggregator is excluding something the project considers circulating.
Neither party is lying, and a reader comparing two assets is effectively comparing two editorial processes. The useful discipline is to use one source consistently within a comparison, and to check the one figure that is not editorial at all: the maximum supply, because a cap written into the protocol is a rule rather than an estimate.
How the number changes behaviour
Metrics are not passive descriptions, and this one is used as a filter at several points in the market. Ranking pages sort by it, which decides which assets a casual visitor sees at all. Index products weight by it, which decides how much of a basket any single token represents. Screener tools let users set a minimum, which decides what a systematic trader will even look at. Screening for assets above a threshold excludes most of the market, and the threshold is almost always chosen in these units.
The consequence is reflexive. An asset that is included in an index receives passive buying, which supports its price, which increases its weight, which increases the passive buying. An asset below a common screening threshold receives none of that attention regardless of its other qualities. That is not a property of the metric being wrong; it is a property of any widely used screen, and knowing it makes the difference between reading a ranking and treating it as a discovery process.
The denominator problem, applied to flows
Once a reader starts using market value as a scale for other numbers, the definitional wobble becomes infectious. A flow figure expressed as a percentage of market capitalisation inherits whatever the denominator provider decided, and two analyses of the same inflow can differ by a meaningful amount for that reason alone. The error is rarely large enough to change a conclusion and it is always large enough to make a comparison between two sources unreliable.
The same caution applies to the category total, which is the sum of figures that were compiled with different definitions by different providers, some of which exclude assets that others include. The number is useful as an indicator of the direction of prices across the sector and is not the size of anything that exists. Treating it as a valuation and then applying a ratio to it produces a compound of two estimates whose margins of error do not cancel.
Assets that are counted more than once
The last definitional problem is the most concrete, because it involves the same value appearing in more than one place. Tokens that represent a claim on another asset, receipts issued for a staked position, and versions of a coin issued on several networks, in some cases by several bridges, all add to a total without adding new value.
A staked receipt is the clearest case. The staked position exists and the receipt exists, and only one of them should be counted, since the receipt is a claim on the position rather than an additional asset. When a market capitalisation is computed for the receipt as though it were a separate asset, the same capital is counted twice, and a sector total that includes both is inflated by the amount of the overlap.
Wrapped versions present the same problem across networks, and here the double counting is often unavoidable, because two bridges may have issued two wrappers of the same underlying and both may trade. The honest treatment is to count the underlying once and to treat the wrappers as claims, which is what a careful analyst does and what no ranking page does, because the ranking page is built from listings and a wrapper is listed separately.
The number in a headline, and where it came from
Most market values that appear in a news story were not computed by the journalist. They come from a ranking page, which takes them from an aggregator, which compiles them from the quantities projects disclose and the prices venues publish. Each step in that chain is a reasonable practice and each step introduces a dependency that a reader cannot see from the finished sentence.
The consequence appears whenever a figure is repeated often enough to become a fact. A token described as a two-billion-dollar project in one article is described that way in the next, and the definition behind the number stops being carried along with it. When a later correction arrives, it usually arrives as a disagreement between two data providers rather than as a revision of the original reporting, which leaves readers with two numbers and no way to choose between them.
The habit that survives this is to treat a quoted market value as a citation rather than a measurement, and to ask which provider and which denominator produced it. The question is usually answerable in a minute, and the answer frequently changes the comparison that the number was being used to make. A figure without a source is not a fact about an asset; it is a fact about a conversation.
What the number is really good for
Market capitalisation is a price multiplied by a definitional quantity. It is useful as a rough scale, indispensable as a denominator for flows, informative when compared with its fully diluted version, and misleading when read as wealth, as investment, or as a price for the network itself.
The habit worth adopting is to read the second term before the first. The price is what the market published; the quantity is what somebody decided, and the decision is where a reader can still be early. A token with a large reserve and a published unlock calendar is not hiding anything; it is waiting for anyone who bothers to divide one number by another, and that division is the entire difference between reading a ranking and understanding a supply schedule.


