


A week of market data can be arranged in three ways. There are things that move prices when they change, things that prices move, and things that merely share a cause with the price. Most commentary takes the third group and describes it as the first, which is why so much of it is unusable: a fact that is downstream of a price move cannot forecast the next one, and a fact that coincides with it by shared cause should be ignored in both directions. The week ending 2 October 2026 is a clean test case, because it contains all three kinds in generous quantity and a price move large enough to make the distinctions matter.

The move, with the numbers attached
Bitcoin rallied into the week’s main data release, touching an intraday high in the high $86,000s before slipping back below $86,000, a gain of roughly two to three percent on the day and a third consecutive weekly advance. The larger context is more interesting than the day: the third quarter closed up about 43 percent, the best quarter since 2024, and September added roughly 6.4 percent even after a year that had seen the price fall as low as $58,000. Year to date the asset was still marginally negative, which is the most useful single fact about the whole rally.
The rest of the market moved less. Ether traded in the $2,700 area with a gain under one percent, Solana was about three percent higher near $122, and XRP sat near $1.50. A sentiment index that ranges from fear to greed printed in the low 70s, which is the greed band and not the extreme. Liquidations over 24 hours totalled roughly $327 million, and about three quarters of that was short positions, with bitcoin liquidations near $136 million and roughly nine tenths of them short.
| Reading | Value as reported | What kind of number it is |
|---|---|---|
| Bitcoin intraday high | High $86,000s, then back below $86,000 | A price |
| Quarter-to-date move | About +43 percent in the third quarter | A realised return |
| Sentiment index | Low 70s, the greed band | A survey of positioning and volatility |
| 24-hour liquidations | About $327 million, three quarters short | A consequence with feedback |
| Ten-year Treasury yield | 5.34 percent intraday, later about 5.25 | A driver |
| Odds of a hike at the next meeting | Fell from about 70 percent to the mid-20s | A forecast |
Driver one: the interest rate, which is upstream of everything
The single most consequential number of the week had nothing to do with crypto. The yield on ten-year United States Treasury notes reached 5.34 percent intraday, the highest since 2002, before easing to around 5.25 percent, and the market’s implied odds of another policy rate increase at the next central bank meeting fell from roughly 70 percent to the mid-20s. That reversal was driven by two things: a core inflation reading that came in softer than expected at three percent year over year, and a policy-maker’s remark that the committee may need more time before adjusting policy again.
Two features of that sentence deserve emphasis, because they invert the template most readers carry into crypto coverage. The first is that this is an environment of rate increases, not cuts: the policy rate was raised earlier in the year, and the debate is about whether there will be more. The second is that the sensitivity runs the other way from the usual story about central banks being friendly to risk assets. A softer inflation print and a dovish remark lowered the risk of further tightening, which lowered long yields, which raised the present value of every long-duration asset in the market, including one that has no cash flows at all.
This is a driver in the precise sense used here. If the number had come in hot, everything below in this article would have moved in the opposite direction, and the mechanism would have been the same. Nothing in the crypto market had to change for the price to change, which is the defining property of an upstream variable.
Driver two: positioning, which is upstream in a different way
Rates explain the direction. Positioning explains the shape. A market in which a substantial share of participants is positioned for further downside does not rise smoothly; it snaps. The liquidation data for the week describes exactly that: three quarters of the total and nine tenths of the bitcoin portion came from short positions, which means the move was partly financed by people being forced to buy back what they had sold.
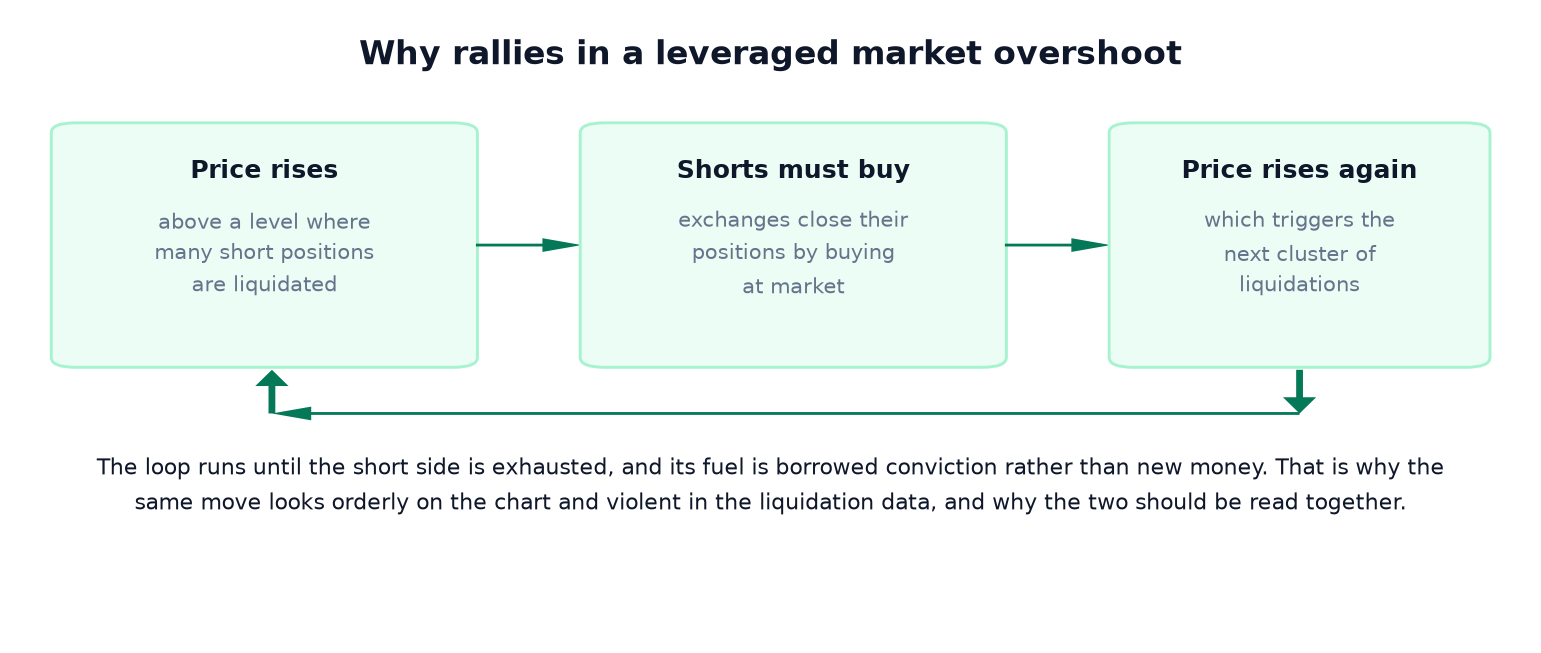
Positioning is a driver rather than a consequence because it is measurable in advance of the move. Open interest, funding rates and the distribution of liquidation levels are published continuously, and they describe how much fuel is sitting on one side of the market. A rally into a heavily short book will be faster and larger than the same rally into a balanced one, and the difference is visible before the fact rather than after.
The distinction also explains an apparent contradiction. A squeeze can lift a price without changing anyone’s view of the asset’s value, which is why a violent move and a modest sentiment reading can coexist. The sentiment index in the low 70s after a nine percent month is not a market that believes something new. It is a market that has been forced to cover, plus a market that has been paid to hold, plus a small number of participants who did change their view.
Consequence one: exchange-traded fund flows
The flows that dominate coverage are the clearest example of a variable that is mostly downstream. The sequence for this period is almost a diagram of the distinction: nine consecutive sessions of inflows worth about $3.1 billion through 29 September, a break on 30 September with roughly $149 million of net outflows, and a return to positive flows on 1 October of about $103 million led by a single fund at nearly $196 million. The month closed at about $2.65 billion of net inflows, the second-largest monthly figure since October 2025 and still below August.
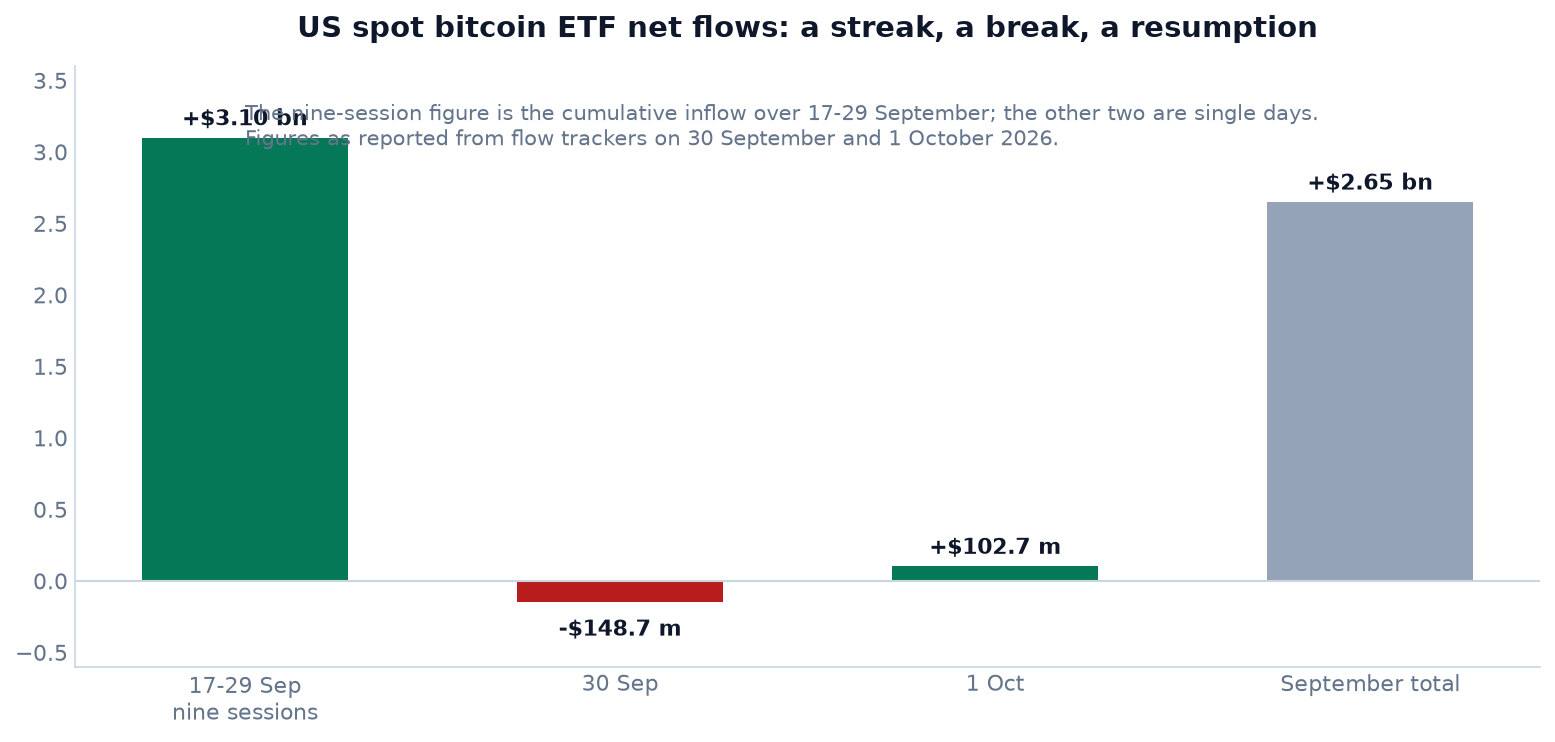
Reading that as a cause of the price rally is the standard error of the genre, and it is easy to see why the error is made. Fund flows are reported daily, denominated in dollars, and published by named institutions, which makes them feel like the solid part of the analysis. But a creation order is executed after somebody decides to allocate, and that decision is made in response to the same rate and positioning variables described above. The flow is a record of the decision, not its origin.
What flows are good for is measurement, and on that axis the numbers are informative. Cumulative net inflows since the funds launched in January 2024 exceed $57 billion, with net assets above $100 billion in one widely cited snapshot, equivalent to a little under six and a half percent of bitcoin’s market value. Year-to-date flows are only modestly positive, and cumulative flows remain several billion dollars below the peak reached in early October 2025. Put together, the picture is a large and persistent institutional bid whose pace tracks sentiment, not a fire hose that explains a two percent day.
Consequence two: liquidations, which feed back
Liquidations sit in a fourth category that the three-way split needs to accommodate. They are unambiguously a consequence: they happen because a price moved. But they also become an input to the next move, which is why a leveraged market can produce a rally that looks disproportionate to the news.
The mechanism is mechanical rather than psychological. A position with borrowed capital is closed by the venue when its margin is exhausted, and closing a short means buying. Enough of those closures in the same direction, in a market with finite near-term liquidity, produce a price move that triggers the next cluster of levels. The loop stops when one side of the book is exhausted, which is why a squeeze is fast, finite and followed by a period of lower volatility rather than by an immediate reversal.
For anyone reading a move, the practical rule is that liquidation data is a validator and not a predictor. Heavy short liquidations confirm that a rally was partly mechanical. They cannot tell you whether the next week will have the same conditions, because the fuel they measured has been consumed in producing the number.
The data that was neither
The week also produced a set of headlines that belonged to neither category, and this is where most cross-asset commentary goes wrong. Oil rose sharply on a supply restriction and a military build-up in the Middle East. The spread between French and German ten-year bonds reached its widest level since 2012. The dollar touched an eighteen-month high and then retreated. One manufacturing survey printed soft while a composite survey printed at its strongest level since mid-2021, with the fastest hiring in more than four years.
None of those events was caused by crypto, and none of them caused the crypto move. They and the crypto move share a cause, which is a macro regime in which long-term borrowing costs are being repriced and geopolitical risk is being added to the price of energy. When a shared cause produces two co-moving series, a coherence appears in the charts that has no predictive content. Trading the relationship will work until the shared cause changes, and then it will fail without warning.
The test for this category is uncomfortable but simple. If a variable moved for a reason that can be stated without mentioning the asset you are trading, and its timing does not lead the asset, it belongs here. Oil, European bond spreads, and the dollar index all pass that test for this week.
The sorting, on one page
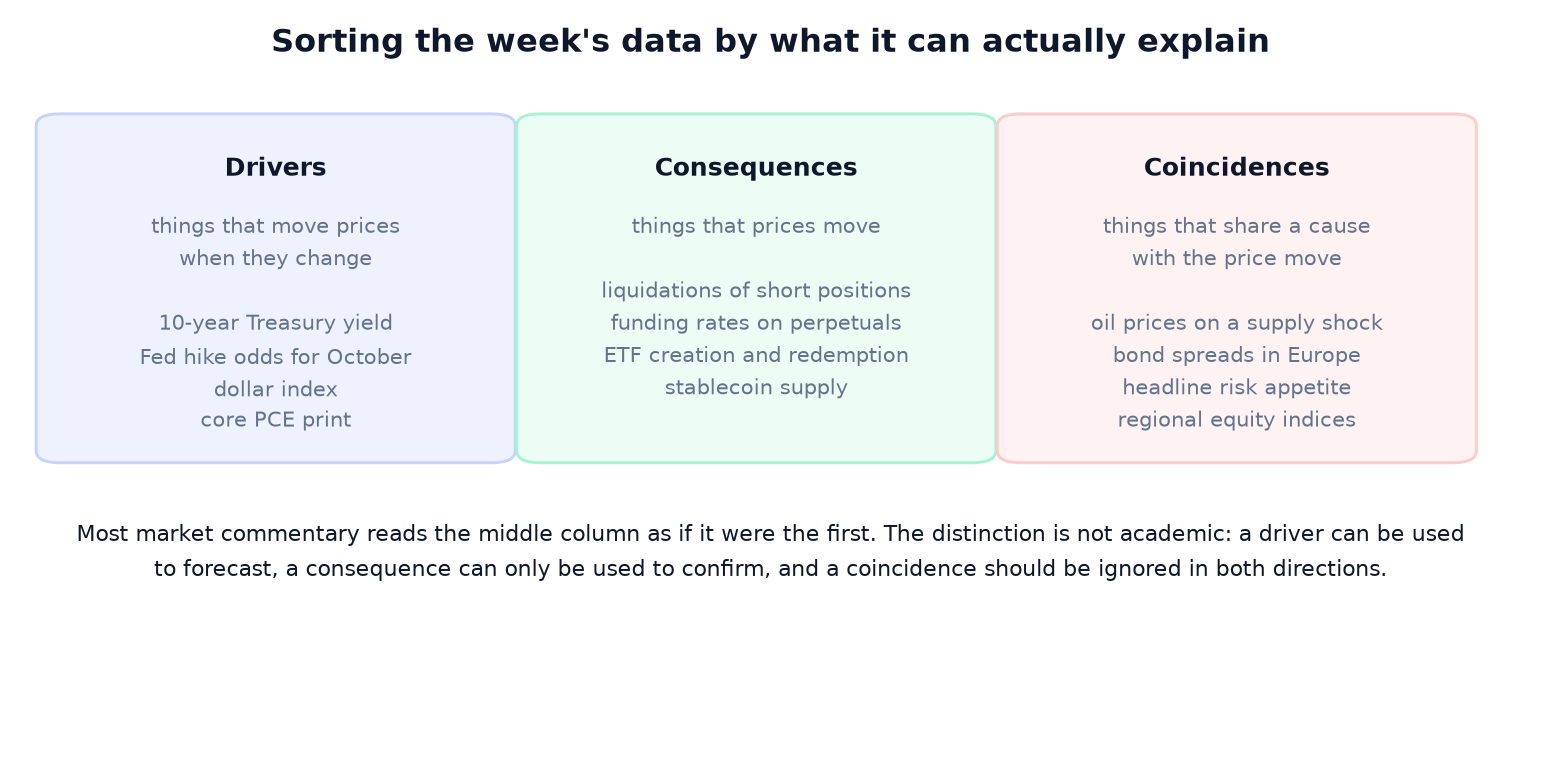
What belongs in the first column is short. Long-term yields, the odds assigned to the next policy decision, the inflation prints that inform those odds, and the positioning of leveraged participants. Each of those can be measured before the price moves and each of them changes what the price should be. What belongs in the second column is longer and more quotable: fund flows, liquidation totals, funding rates, stablecoin supply, spot exchange volumes. Those measure what happened.
What belongs in the third is the longest list of all, because the world produces an unlimited supply of events that share causes with each other. The discipline the split imposes is not sophistication; it is refusing to put a measured consequence or a shared-cause coincidence into the position reserved for a driver, where it will be used to forecast something it has no power over.
What the forecasts are worth, by contrast
Two published numbers from the same week illustrate how differently the market treats a forecast and a measurement. A large bank raised its twelve-month target for bitcoin from $82,000 to $113,000, citing persistent fund inflows and institutional demand, while the sentiment index sat in the greed band. Both are statements about expectations. Neither is a measurement, and both are updated in response to the same variables as the price itself, which means their movement contains no information that the price does not already contain.
That is not an argument against targets. It is an argument about their category. A target is a driver only if the act of publishing it changes behaviour, which it occasionally does for a short window and never durably. Treating a research note as an input to a model, when the note was produced by a process that reads the same outputs, is the definition of a loop that produces confidence without information.
A useful habit follows from the split. When a market commentary item arrives, ask which column it belongs in, and then ask what the number would have looked like if the price had gone the other way. If the answer is that it would have been the same, the item belongs in the third column and can be ignored. If it would have been opposite, the item belongs in the second and can be used to confirm. If it would not have changed at all because it was published before the move, only then is it a candidate for the first.
The labour report as an accidental experiment
The week ended with a scheduled release that functions as a test of the sorting above. A labour market report was due with consensus expecting a sharp slowdown in hiring from the previous month’s figure, and unemployment expected to hold steady. The reason it matters to this article is mechanical: the release moves one of the first-column variables directly, and it moves it in a direction that was not known in advance.
Run the three scenarios through the categories and the sorting becomes testable rather than rhetorical. A stronger-than-expected number would push yields up and revive the odds of further tightening, which would pressure the price through the discount-rate channel described earlier. A weaker number would do the opposite. A number in line with consensus would move nothing, because expectations were already priced. In all three cases the transmission runs from the data to the rate to the asset, and in none of them does a fund flow or a liquidation figure act as an input to the chain.
Two cautions belong with that experiment. The first is that consensus is itself a forecast, so “better than expected” and “good” are different statements, and the market trades the first one. The second is that the mechanism has already produced a measurable precedent this year: a much stronger print earlier in the year was followed by a price move below $80,000 and an increase in the odds assigned to tightening. That sequence is the clearest available evidence for the direction of the arrow.
What the week did not measure
A sorting exercise is also a list of absences, and the absences in this week’s data are worth naming because they define the boundary of what can be concluded. Four variables that would normally frame a reading of supply and demand were not part of the published picture: the balance of coins held at exchanges on behalf of customers, the net change in stablecoin issuance, implied volatility and skew in the options market, and the net position of mining operations.
The gap is not accidental. Custody has fragmented across venues, custodians and self-custody arrangements, which means “exchange balances” describe a shrinking share of the float. Stablecoin supply moves across several chains and several issuers at once, so a single number hides more than it reveals. Options data is published by venues that do not use the same expiry conventions. And miner positions are disclosed quarterly at best, if at all.
What remains measurable is still enough to describe one side of the market with precision, and it is worth stating which side that is. Funding rates, open interest and the distribution of liquidation levels describe leverage: who is borrowing to hold a position, in what direction, and how close the nearest margin thresholds are. Fund flows describe the institutional wrapper. Together they cover the financed part of the market and the regulated part of it, which is a large share of the volume and a smaller share of the ownership.
The honest conclusion from that asymmetry is not that the data is bad. It is that this week’s numbers describe positioning and flows accurately while describing ownership only by inference, and claims about “who is buying” that rest on flows alone are claims about a wrapper rather than about the coin. The distinction belongs in the same sorting as everything else: it is a driver of nothing, a description of the leveraged and regulated surface of the market, and a reminder that the part of the picture which cannot be measured should not be filled in with the part that can.
What would change the sorting
Categories are not permanent, and the interesting question about a given variable is which way it is likely to move between columns. Flows would become a driver if institutional allocation began to follow a rule rather than a sentiment, for example a mandate that adds on a schedule regardless of price; there is no evidence of that in this week’s data. Positioning would stop being a driver if leverage left the system, which would make rallies smoother and smaller rather than faster and larger.
The macro column has the clearest condition attached to it. Long yields are a driver for as long as the market is uncertain about the direction of policy, and they become less of one as that uncertainty resolves: when the next meeting’s decision is well understood in advance, the same yield number carries less new information, and crypto’s sensitivity to it falls. The week’s headline event — a labour market report that consensus expected to slow sharply — matters in exactly that way, as a resolution or a worsening of a single uncertainty rather than as a data point about the asset.
Two other items in the week belong to the second column in the long run and are worth noting because they are structural rather than cyclical. The first is that one bank-issued bitcoin fund crossed ten thousand bitcoin in assets for the first time, which is a distribution milestone rather than a price event. The second is that a European regulator opened its authorisation window for crypto firms, with a compliance deadline in 2027, which changes the cost of doing business for a set of companies and therefore the economics of the vehicles that hold the asset, not the asset itself.
The one sentence that survives the week
Bitcoin rose because the price of long-term money fell and because the short side of a leveraged book was forced to buy, and everything else that was published described one of those two facts, followed from them, or happened at the same time for an unrelated reason. That sentence is not a forecast and it does not need to be one. It is what remains after the week’s data has been sorted by what each number can actually do: drive, describe, or merely accompany.
The habit is portable beyond this week. A market where the driver is the price of money and the loudest published numbers are consequences will keep producing commentary that reads like explanation and functions like weather reporting after the fact. The same sorting exercise applied to the seasonal data produced a similar result earlier in the month: a statistic describing ten past Octobers cannot forecast this one, while the funding rate that was measurable in advance could describe how much fuel was left in the book.


[…] funding rate is a better measure of that fragility than the price chart. Our earlier analysis of bitcoin’s move toward eighty-six thousand dollars made the same point about separating drivers from […]
[…] flows followed them, which is the ordering that has held in this market since the funds launched. Flow figures describe decisions rather than cause them, and a reconciliation makes the lag visible in a way that a story about institutional demand does […]