


The September payrolls report landed on Friday, October 2, and the number was bad in the way markets had been hoping for. Roughly twenty-nine thousand jobs were added against a consensus nearer ninety thousand, and the prior month was revised down. Bitcoin rose about three percent into the mid-eightysix-thousand range within hours, Ethereum moved with it, and the familiar headline wrote itself: weak data, softer Fed, risk assets up.
That headline is true and it is the less interesting half of the week. The move that carried more information was not in the price of bitcoin but in the price of staying long it. Perpetual funding rates, the running cost a leveraged trader pays to hold a position, roughly tripled, and open interest climbed alongside the price. Two markets moved at once, and they were saying different things. One said the rate path had changed; the other said the crowd was leaning into the same side of the boat, and paying more every eight hours for the privilege.


What the number actually was
Start with the fact, because everything downstream is a reaction to it. The September nonfarm payrolls print came in near twenty-nine thousand jobs, far below the roughly ninety thousand expected, and the August figure was revised lower to about one hundred thirty-three thousand. A single month of a noisy series is never decisive on its own, which is exactly why the market’s reaction is worth separating from the number itself.
The reaction was visible in rate expectations within the hour. The implied odds of a rate hike at the October meeting, as priced by the futures market, fell to roughly a quarter from a bit over a third. That repricing is the mechanism that connects a labour statistic to a crypto price, and it is worth stating plainly because the connection is not direct: a weaker labour market makes further tightening less likely, a less likely tightening lowers the discount rate applied to every long-duration asset, and bitcoin is the longest-duration asset the market prices.
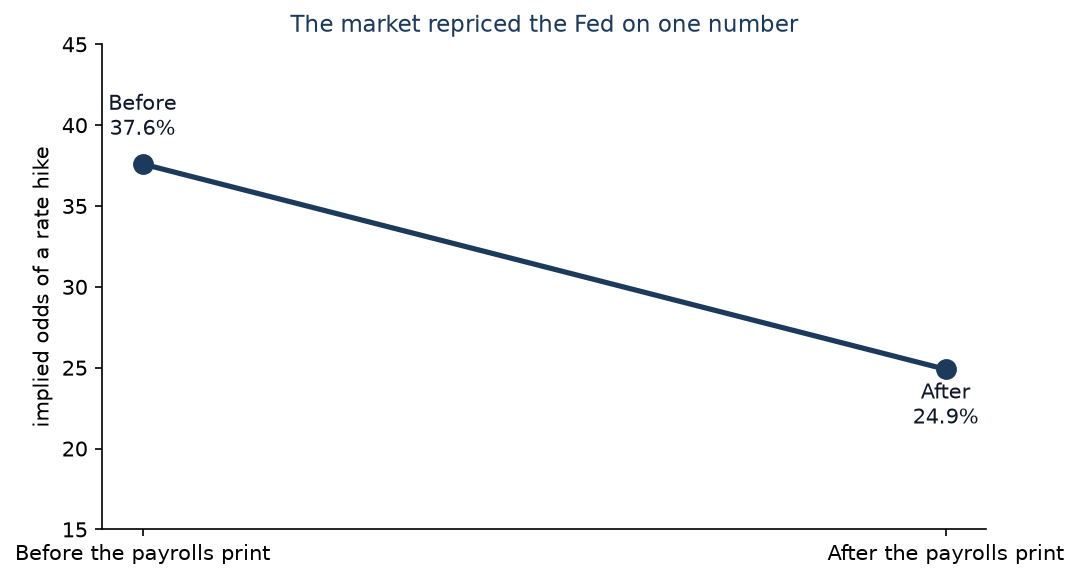
Two caveats belong here. The first is that a rate-hike probability is not a forecast of the economy; it is the price of a bet, and prices move on flow as well as on information. The second is that the labour series is revised, sometimes substantially, and a single print that later gets revised is a thin foundation for a durable re-rating. The market knows both, which is why the durable question is not whether bitcoin went up but whether the leverage that went with it can be carried.
Why a weak jobs number lifts a risk asset
The mechanism is a chain of three links, and each is worth naming because the chain breaks somewhere every cycle.
The first link is the policy path. The Fed sets a short rate, and the forward market prices the path; a weaker labour market shifts the market’s expectation of that path downward. The second link is the discount rate. In any valuation, an asset that produces its cash flows far in the future is worth more when the rate used to discount them falls, and a cryptocurrency with no cash flows at all is best understood as the purest version of that long-duration asset, priced largely on the rate and on liquidity. The third link is positioning. A lower discount rate justifies a higher price, and the price move itself attracts flow, which is where derivatives enter the story.
The chain is why the phrase bad news is good news exists in this market, and it is also why the phrase is dangerous. A labour report can be weak in a way that is good for the discount rate and weak in a way that signals an economy going into a downturn, and the same headline can trigger both readings. The market spent the week on the first reading. That is a position rather than a conclusion.
The move people missed: the cost of leverage
While the spot price rose about three percent, the derivatives tape did something more violent. Open interest in bitcoin futures rose by several percent to roughly six hundred fifty thousand contracts, and the annualised perpetual funding rate climbed from about three percent to about ten percent. A number that triples is the kind of move that changes behaviour, and the behaviour it changes is the willingness to hold a leveraged long.
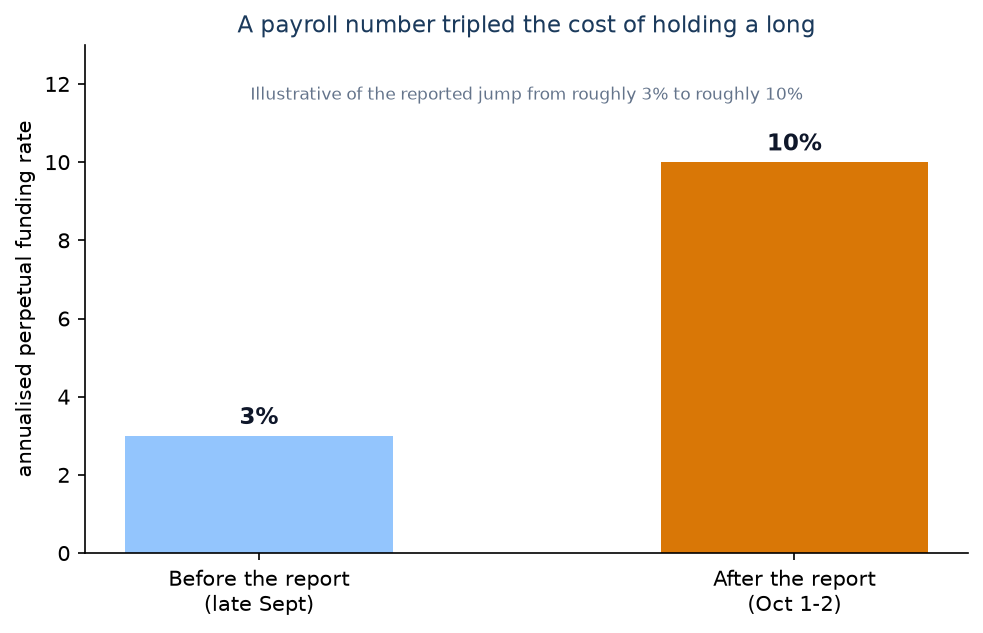
The two facts, rising open interest and rising funding, are not independent. Open interest measures how many positions exist, and funding measures how much the majority of them are willing to pay to stay on their side. When both rise together, the market is not merely repricing; it is adding leverage into a move that has already happened, which is the setup that turns an ordinary pullback into a cascade.
What the funding rate is, in one paragraph
A perpetual contract has no expiry, so nothing forces its price back to the underlying the way an expiring future converges. The mechanism that does the forcing is a periodic payment between the two sides of the book: when the contract trades at a premium to the index, longs pay shorts, and when it trades at a discount, shorts pay longs. The rate is set largely from the size of that premium, with a cap, and it settles every few hours. The consequence is that a leveraged position has a running cost measured in hours rather than in a single fee, and the cost rises precisely when the trade is crowded. If you hold derivatives at all, the funding page is the second screen to keep open, after the order book.
Reading the derivatives tape correctly
The trap in a week like this is to read one derivative number and stop. Each of the three commonly cited measures answers a different question, and they only mean something together.
Open interest tells you how big the book is, in contracts, and says nothing about who is paying. Funding tells you which side is paying and roughly how badly they want to stay, and says nothing about the size of the book. Spot price tells you what the marginal trade cost, and says nothing about the leverage behind it. A rising price with flat open interest is flow moving through an existing book; a rising price with rising open interest is new leverage arriving; a rising price with rising open interest and rising funding is a crowded trade that is now expensive to hold. That third description is the one that applied to this week, and it is the one that matters most for what comes next.
What a triple in funding does to a crowded book
The problem with an expensive crowded trade is not that it is wrong; it is that it is fragile. Three mechanisms convert that fragility into a move.
The first is simple arithmetic. A position that pays ten percent annualised in funding needs the underlying to appreciate by roughly that much over the year just to break even, and a trader who is right on direction but slow on timing can lose to the carry. The second is the liquidation engine. A leveraged position has a price at which the venue closes it without asking, and the more of the book that sits at similar leverage, the more of the book sits at similar liquidation prices. The third is reflexivity. When a cluster of liquidations triggers, the forced selling pushes the price toward the next cluster, and the funding cost that caused the first exit is still being charged to everyone who remains.
None of that is a prediction. It is a description of why the same piece of news can produce a calm repricing in a market with little leverage and a violent round trip in a market with a lot of it, and why the funding rate is a better measure of that fragility than the price chart. Our earlier analysis of bitcoin’s move toward eighty-six thousand dollars made the same point about separating drivers from consequences.
Why the spot move and the leverage move are different trades
It is worth being explicit that the two moves in this week’s tape were not the same trade wearing two hats. The spot move was a macro repricing: a rate path shifted, and every long-duration asset re-valued. That trade is owned by people who hold the asset, and its payoff is the change in the discount rate plus whatever adoption does over a longer horizon. The leverage move was a positioning event: a crowd took the same view and borrowed to express it, and its payoff is the difference between the move and the funding paid along the way.
The second trade can be profitable and is more fragile, and the reason is structural rather than a matter of skill. A spot holder has no schedule to beat. A leveraged holder has a funding clock and a liquidation price, and both are set by the crowd that holds the same position. When the crowd is right, the funding is cheap and the leverage works; when the crowd is crowded, the funding is expensive and the exit is narrow. This week the crowd got more crowded, and the schedule got more expensive, at the same time.
What to watch next
Three variables follow directly from the above, and all three are observable.
The first is the funding rate itself over the following days. A rate that stays elevated while price stalls is the signature of a trade that is paying to wait, and a rate that normalises after a pullback is the signature of leverage being cleared rather than added. The second is the FOMC meeting at the end of October, because the whole macro leg of the move is a price on that path, and a repricing in the other direction undoes it. The third is whether spot ETF flows resume, since steady inflows absorb selling in a way that leverage cannot, and the streak that had been running into the end of September had already cooled. The fourth variable is the least discussed and worth naming: the level that matters is not the one the price reached but the one where the most leverage was added, because that is where the liquidations live. This is the same framework we applied to October’s setup read in four numbers.
The distinction worth keeping
A weak payroll report changed the market’s price for Fed policy, and that is why bitcoin rose. The same week, the cost of being leveraged long roughly tripled, and that is why the rise is more fragile than it looks. The headline captured the first fact and missed the second, and the second is the one that decides what happens on the next disappointing day. Nothing about this is a prediction that the price falls; it is a statement that the market added expensive leverage to a trade that had already paid, and that a market in that state responds to bad news differently from a market with a clean book.
The useful discipline, as ever, is to keep the two trades separate in your own head. If you hold the asset, the funding rate is somebody else’s problem and a source of information. If you hold the contract, the funding rate is your rent, and rent went up this week. The people who lost money in similar setups did not get the direction wrong; they ran out of time and paid the carry until the liquidation engine finished the argument. For the mechanics of that engine, see our explainer on what gas and fees actually pay for on-chain, which is the on-chain cousin of the same running-cost idea.
The carry trade, and why a high funding rate is a business
It is easy to read a tripling funding rate as pure danger, and the same number is also the input to a trade. A positive funding rate is an incentive: if the perpetual trades above the index, longs pay shorts, so a position that is short the contract while holding the underlying collects the difference, with the price exposure hedged by construction. This is the cash-and-carry trade, and it is one of the oldest structures in any futures market. Its yield is the funding, its risk is basis and execution, and it exists because someone else wants leverage enough to pay for it.
That is why a high funding rate is not simply a warning; it is a stream of income that attracts capital to supply the other side, and the capital that arrives to collect it is the capital that eventually flattens the rate. The mechanism is self-correcting in normal conditions. The problem is the speed: it takes time and balance-sheet capacity to assemble the hedge, and the crowd that pays the funding can be liquidated long before the offsetting supply arrives. A rate that triples in a day is a rate that tells you the demand for leverage arrived faster than the supply of hedges, and the gap between the two is where the violent moves happen.
How the two markets feed each other
The spot market and the derivatives market are not two independent views of the same asset; they are two loops that touch each other through a handful of participants, and the touching is where the feedback lives.
Start with the loop inside derivatives. A rising contract price pulls in leveraged longs, the longs pay funding, a high funding rate attracts hedgers who short the contract against spot, and that selling pressure on the contract tightens the basis. Now open the loop to spot. A spot buyer who uses the contract to hedge is buying the underlying and selling the contract, which lifts spot and compresses the premium at the same time. In a healthy market the loops settle into a modest funding rate and a tight basis, and the position that was crowded unwinds at a pace that does not force anyone out.
In a stressed market the loops reinforce instead. A price spike triggers liquidations of leveraged longs, the forced selling marks the price down, the markdown triggers more liquidations, and the spot market absorbs the flow with slippage, which widens the basis and raises the funding rate on whoever is left. The level at which each of these turns from stabilising to destabilising is not a fixed number; it is a function of how much of the book sits at similar leverage. That is why the same percentage move is a nothing event in one week and a cascade in another.
A short checklist for reading a derivatives week
The analysis above compresses into a short list, and the list is more useful than any single indicator.
First, write down the policy path, not the policy: what the forward market priced before the data and after it, because that is the variable the macro trade is actually long. Second, separate the spot move from the derivatives move and give each its own number, because a three percent price move and a tripling of funding are not the same fact. Third, check open interest to see whether the move added positions or merely passed through them, since leverage arriving into an existing trend is the fragile case. Fourth, find the price level where the most leverage was added, because that is where the liquidations cluster and it is usually not the price the chart shows. Fifth, look for the hedgers: if a high funding rate is drawing in carry traders, the pressure is self-limiting, and if it is not, the pressure is not.
Run the list and this week reads clearly. The policy path moved, so the macro trade was justified. Open interest rose, so new leverage arrived rather than passing through. Funding roughly tripled, so the crowded side started paying a meaningful rent. And the following days will show whether hedgers showed up to flatten it or whether the crowd kept paying until the liquidation engine settled the account. None of that tells you the price next week; all of it tells you which way the market will break if it breaks.
Frequently asked questions
Why did bitcoin rise on weak jobs data?
A weaker labour market lowers the expected path of interest rates, and a lower discount rate raises the value of long-duration assets. Bitcoin behaves like the purest version of a long-duration asset because it has no cash flows to anchor it, so it moves more than most when the rate path moves.
What is a perpetual funding rate?
A periodic payment between the two sides of a perpetual futures book, used to keep the contract price tethered to the underlying index. When the contract trades at a premium, longs pay shorts; when it trades at a discount, shorts pay longs. It settles every few hours, so it is a running cost rather than a one-off fee.
Why does it matter that funding tripled?
Because it is the rent on the crowded side of the book. A rate that roughly triples means a leveraged long now has to outrun a much larger carry cost, and the crowd paying it is the same crowd that would be forced out first in a pullback.
Does rising open interest confirm a rally?
No. Rising open interest confirms that new positions are being added, and it says nothing about which side is paying or how sustainable the move is. It is only informative alongside funding and spot price.
Is a rate-hike probability a forecast?
It is a price, not a forecast. It reflects the market’s expectation of policy and this week reflected a sharp change in that expectation, and it can move again on the next data point or on flow rather than on new information.
What should holders watch next?
The funding rate over the following days, the late-October FOMC meeting, whether ETF inflows resume, and the price level where the most leverage was added, because that is where liquidations cluster.
Sources and further reading
The payrolls figure, the funding-rate change and the open-interest move described here are as reported in market coverage around October 2, 2026, and the rate-expectation shift is from the futures-implied odds. Numbers of this kind are revised and re-reported, so treat them as of that date rather than as settled.
For related analysis, see our piece on the move toward eighty-six thousand dollars and the data that was neither driver nor consequence, the framework in October’s setup in four numbers, and the flow context in bitcoin ETF flows after the Clarity Act failed. The mechanics of fees as a running cost are set out in what gas on Ethereum really pays for.


