


A quarter can be reviewed two ways: as a story, which is easy and useless, or as a reconciliation, which takes work and produces something a reader can use. A reconciliation compares what people expected when the quarter began against what actually happened, line by line, and it produces three kinds of entry: expectations that were right, expectations that were wrong in a direction nobody anticipated, and expectations that did not matter because the market was watching something else. The third kind is the most informative, and it is almost never in the story version.
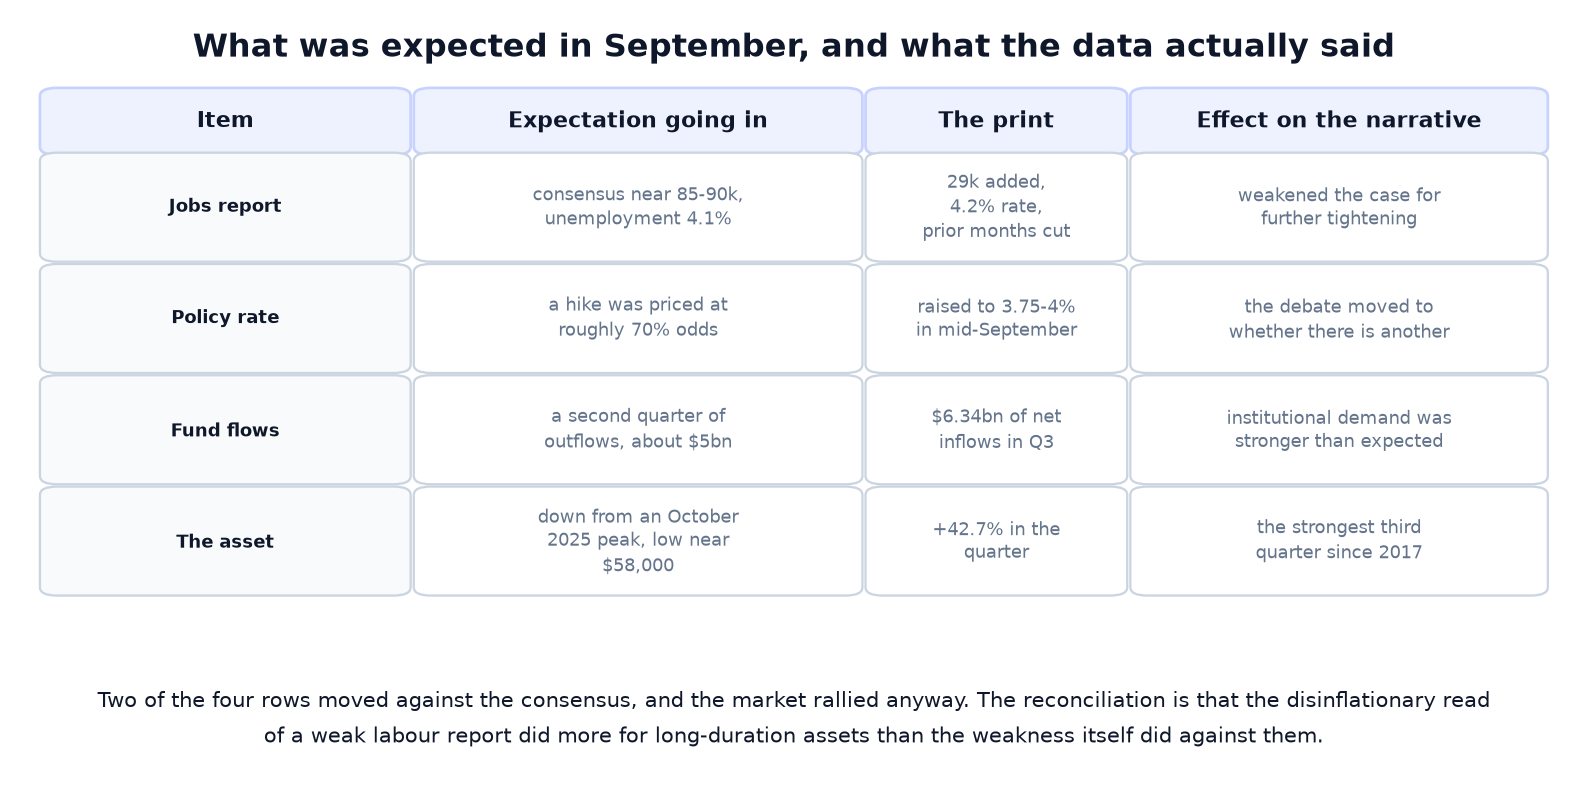
The quarter that ended in September 2026 offers an unusually clean reconciliation, because its four main variables were all forecast publicly in advance. There was a consensus for a labour market report that did not exist yet. There was a priced probability for a policy decision. There were published estimates for fund flows and for the asset. Two of those forecasts were wrong in ways the market treated as good news, one was directionally right with a magnitude nobody positioned for, and one was simply too pessimistic by an order of magnitude. Here is the account, as it stood in July, and as it printed.
Line one: the labour market, where the forecast was wrong
The expectation going into September was a slowdown: consensus around eighty-five to ninety thousand jobs added, with the unemployment rate holding near its recent level. The print was far weaker than that, with only twenty-nine thousand jobs added, an unemployment rate a tenth higher, and downward revisions to the previous two months of roughly sixty thousand. In forecast terms, this was not a mild miss; it was a miss of an order that changes the interpretation of the series rather than the value of a single month.
The reason this line matters more than the other three is mechanical. A labour market that is still adding jobs keeps the question of further tightening open, and an open question about the policy rate is what sets the discount rate for every long-duration asset in the market. A weak report closes part of that question. It does so by weakening the case for the thing that was feared, which is why a soft number on employment can raise the price of an asset that has no earnings at all.
That inversion is the first thing a reconciliation exposes and a narrative hides. In a story about the quarter, a weak jobs report is bad news about the economy. In an account of what moved the price, a weak jobs report is good news about the policy path. Both statements are true of the same document, and only the second one describes why anything traded.
Line two: policy, where the direction was right and the pace was wrong
The rate was raised in mid-September, the first increase since 2023, bringing the policy range to three and three quarters to four percent. That part was anticipated. What was not anticipated with any confidence was what would come next: entering the quarter’s end, the market priced roughly seventy percent odds of another increase at the next meeting, and after the weak report and softer inflation data those odds fell to somewhere in the mid-twenties to high-thirties depending on the measure.
The move from a coin-flip-plus to a minority probability is the largest repricing in the account, and it happened without any change to the policy rate itself. That is the ordinary behaviour of a market that trades expectations rather than decisions, and it is worth stating plainly because it is the mechanism behind most of the quarter’s asset returns: nothing the central bank did changed, and the price of everything downstream of the expected path did.
The next scheduled decision falls at the end of October, which means the account’s largest unresolved entry has a date on it. A reconciliation written now can say what the market expects and cannot say whether the expectation will survive the intervening data, which is exactly the boundary between a review and a forecast.
Line three: fund flows, where the estimate was too pessimistic
The second quarter saw roughly five billion dollars of net outflows from the largest spot funds, which is the kind of figure that trains expectations: after two quarters of redemptions, the third quarter was widely expected to be weak. It printed at about six and a third billion dollars of net inflows, the strongest quarter of the year and a reversal of the same magnitude as the outflow that preceded it.
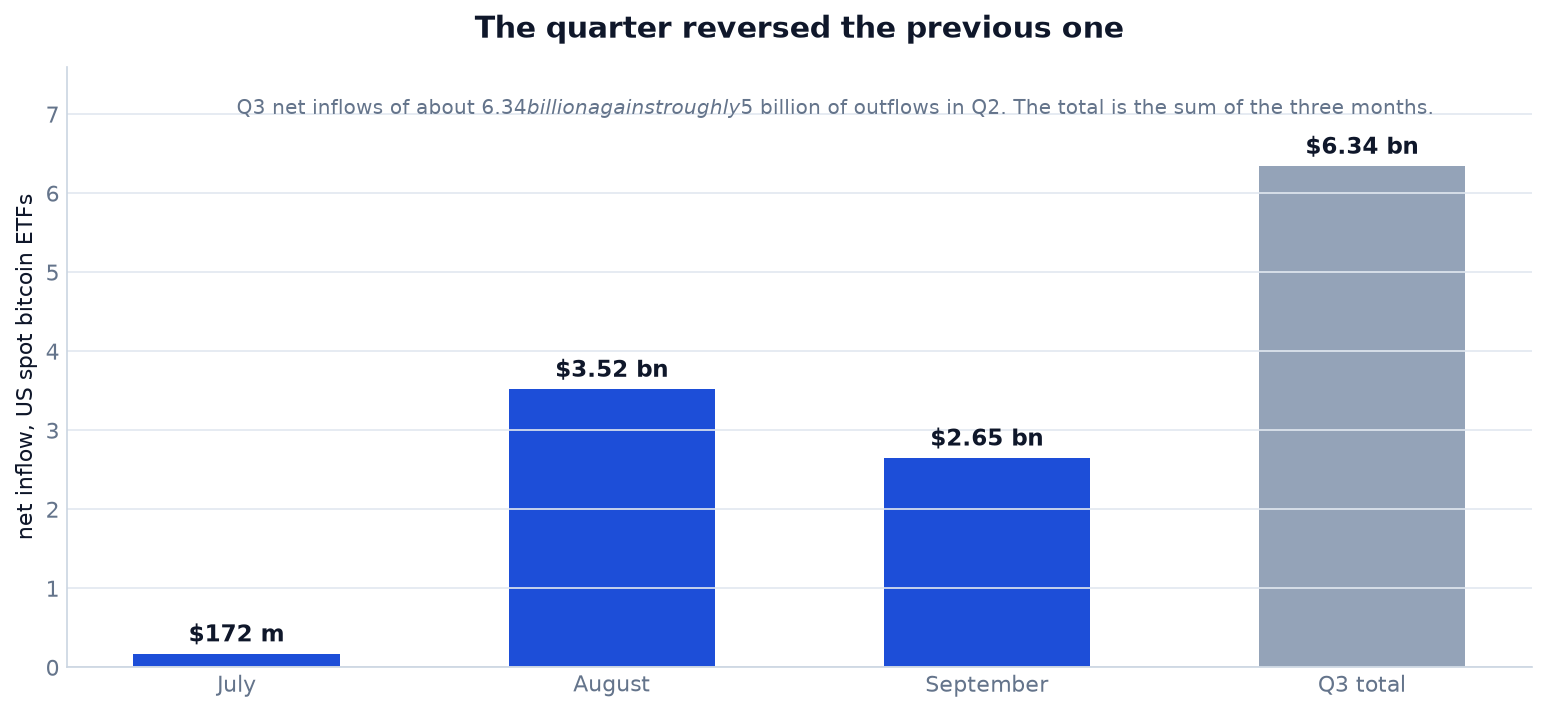
The monthly shape is more informative than the total. July contributed a rounding error, August contributed three and a half billion dollars, and September contributed roughly two and two thirds billion, about a quarter less than August. Within those months the daily figures were extreme in both directions: a single session in late September brought in nearly a billion dollars, the largest since October 2025, and the week containing it was the strongest of the year, while the last day of the month produced the first outflow in nine sessions. Two days later flows resumed, and the first two sessions of October added a further small positive figure.
What the reconciliation says about this line is not that the forecasters were careless. It is that flow forecasts extrapolate from the most recent quarter, and the most recent quarter had been an outflow. Anyone who expected the flows to follow the price would have been better served by watching the price: the quarter’s returns arrived first and the flows followed them, which is the ordering that has held in this market since the funds launched. Flow figures describe decisions rather than cause them, and a reconciliation makes the lag visible in a way that a story about institutional demand does not.
Line four: the asset, where nobody was optimistic enough
The asset entered the quarter having fallen more than half from its peak in October 2025, with a low in the fifty-eights. It closed the quarter up forty-two point seven percent, the strongest third quarter since 2017. Ether, starting from a lower base, rose about seventy-one percent over the same period, from the mid-fifteen-hundreds to roughly twenty-six hundred and eighty-five.
For a reconciliation the interesting entry is not the size of the return but the relationship between the four lines. The asset’s return is the product of the other three: a policy path that turned less restrictive, a flow that turned positive after being negative, and a positioning adjustment that turned into forced buying. None of those three lines is a forecast of the fourth, which is why the returns always look surprising in the review and inevitable in the narrative written afterwards.
Line five: the divergence inside the same quarter
The same quarter produced a much larger price gain for ether and a smaller flow: about three billion dollars of net inflows into the spot ether funds, against a second quarter that had seen roughly seven hundred million of outflows. In the first days of October that split reversed, with the ether funds losing money on three consecutive sessions while the bitcoin funds took in money.
The divergence is a good test of the reconciliation method, because it rules out the explanation that a single macro factor moved everything. If the only input were the policy path, the two assets would have moved and attracted flow together. What the account shows is a beta difference: the smaller, higher-volatility asset captured more of the same macro improvement in price and less of it in regulated-wrapper demand, because the vehicles that provide that demand are smaller and newer.
The practical lesson is about flows as a signal rather than about the assets. A flow series measures the buyers who use one specific wrapper, and the wrapper’s size caps how much of a move it can explain. Reading a bitcoin flow series as a statement about “the market” and an ether flow series as a statement about ether is a category error in both directions.
Line six: the policy path versus the price of money
The reconciliation is incomplete without the variable that ties the others together: the yield on long-dated government debt, which sat near five and three tenths percent during the quarter’s end, in the highest region since 2002. A long-duration asset with no cash flows is exquisitely sensitive to that number, and the sensitivity is the reason the jobs report mattered at all.
This is the line where the market’s behaviour in October becomes interesting. The same labour market data that helped the asset also weakens the case for the government’s borrowing costs to fall quickly, because a slowing economy usually means lower expected policy rates and lower long yields — but the bond market also has to absorb supply, and it has been charging more for that all year. A reconciliation cannot resolve that tension; it can only record that the asset’s rally happened while the ten-year was in the highest region of the century, which is a combination that most models would have called unlikely in advance.
Line seven: positioning, the entry that is never forecast
The account has one entry that was never published in advance and that turned out to be decisive: who was holding what, and in which direction. Large wallet balances accumulated on the order of seventy-five thousand coins over thirty days during the period, while a single session’s decline triggered about two hundred and fifty million dollars of liquidations concentrated in long positions.
The combination is the pattern that produces a quarterly return nobody forecast. Accumulation by large holders shrinks the float available to buyers, and a liquidation event removes a portion of the leverage that was on the other side. Neither is available as a consensus forecast because neither is published as one; both are observable in data that professionals watch daily and that never makes it into a quarterly estimate.
What the reconciliation teaches
Two conclusions survive the exercise, and they are the reason to do it rather than to read a quarterly summary. The first is that the market prices the policy implication of a data point rather than the data point itself. A weak employment report is bad news and was traded as good news, and the same inversion works in reverse: a strong report during a tightening cycle is good news about the economy that the market treats as bad news about the discount rate.
The second is that consensus estimates are produced by extrapolating recent experience, which makes them systematically wrong at turning points and roughly right in the middle of a trend. Every line in this account was forecast by extending the previous quarter, and the quarter that ended in September was a turning point for three of the four variables. A reader who wants to use these estimates well should look at them as a description of what the recent past would predict, and treat the deviations from them as the information.
The position as it stands
Entering the fourth quarter, the observable position is this. The asset traded in the mid-eighties, having briefly touched the high eighty-seven thousands before easing, after a third consecutive weekly gain. The regulated wrappers held about one hundred and nine billion dollars in net assets, with cumulative net inflows since launch of about fifty-seven and a half billion. Corporate treasuries kept buying: one company’s holdings of bitcoin reached a record of more than eight hundred and forty-seven thousand coins after a purchase of about sixteen hundred and sixty-five coins, and a second company’s ether position reached about six million coins, close to five percent of the supply.
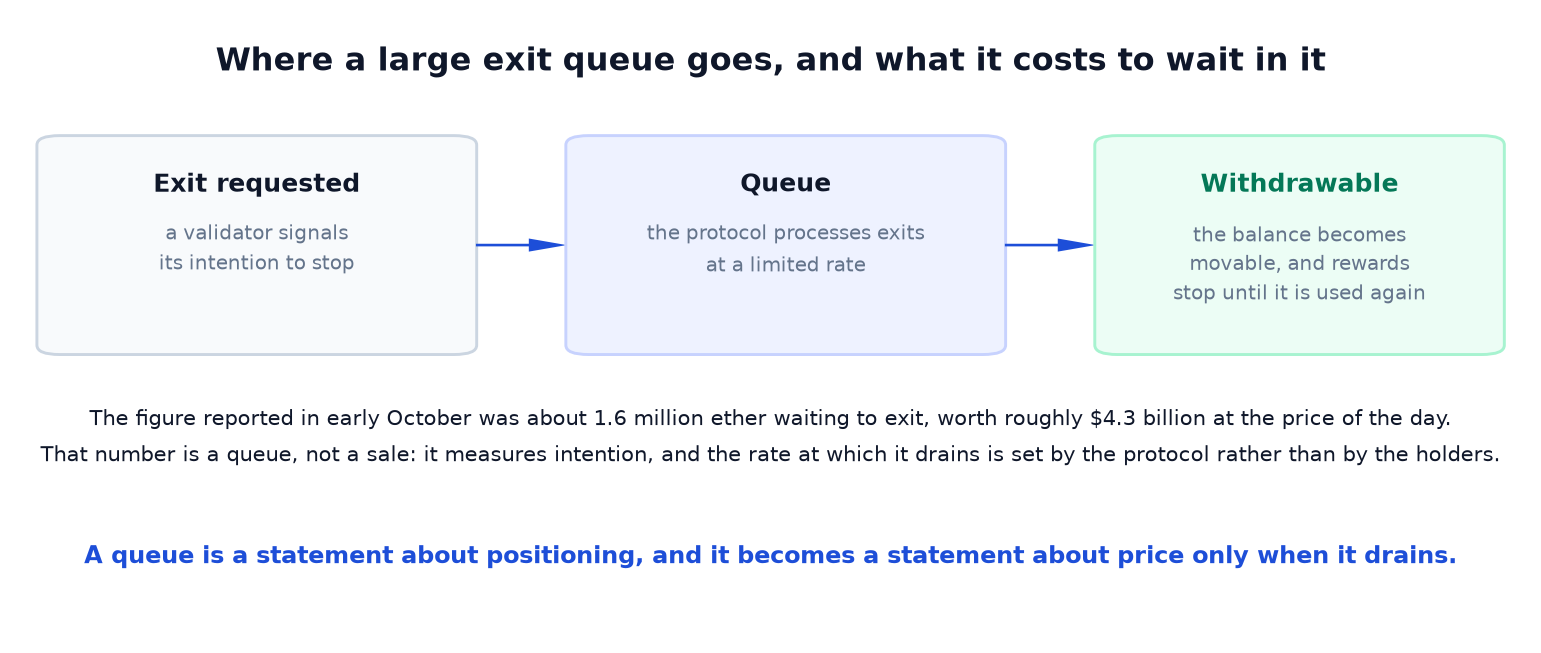
The one figure that reads as a warning sign is a queue: about one and a half million ether waiting to leave staking, worth roughly four and a third billion dollars at the price of the day. The correct way to read it is as an intention rather than a sale, since the protocol processes exits at a rate it controls and the holders retain the option to cancel. The correct way to treat it in a reconciliation is as a supply overhang that has not yet been tested, because the last time a queue of that size drained, the market was in a different regime.
What the next quarter has to settle
Three items are scheduled and one is not. The scheduled items are the next policy decision at the end of October, a run of data before it covering services activity, trade, the minutes of the previous meeting and weekly unemployment claims, and the usual monthly flow reports. The unscheduled item is the interaction between the two: whether a policy path that is now expected to be less restrictive can coexist with long-term borrowing costs in the highest region since 2002.
A reconciliation cannot answer that question, and it can set up the terms in which the answer will arrive. If long yields fall, the discount-rate channel that produced this quarter’s return continues to operate and the flows that followed it have room to continue. If long yields stay high while the policy path eases, the asset rallies on expectations while its valuation headwind remains, which is a more fragile configuration than the quarter just ended.
Where this account is weak
A reconciliation should say what it could not verify, and three limits belong in the record. The flow figures come from trackers that disagree with each other at the margin, which is why a single month can be reported with a different total by two providers and why the quarterly total here is the sum of one provider’s series rather than a consensus figure. The consensus for the labour report is a survey of forecasters rather than a single number, and the range around it was wide enough that “miss” describes the outcome more precisely than any single deviation. And the positioning data is measured by third-party analytics whose methodology is not public, which makes it useful as a direction and unreliable as a magnitude.
Those limits do not change the conclusion of the exercise, which is about which expectations failed rather than about the precision of any number. A reconciliation with stated boundaries is more useful than a story without them, because the boundaries are where the next quarter’s surprises will come from.
Three dates that would have changed the account
A reconciliation describes what happened, and the same numbers arranged on a different calendar would have described a different quarter. Three timing facts in this period are worth isolating, because each of them was an available choice rather than a law of nature.
The first is when the labour data was published. A report that arrives at the end of a quarter influences the quarter’s closing prices rather than its opening ones, and a report released in the middle of a quarter is processed by a market with more time to trade it. The same twenty-nine thousand job gain, published three weeks earlier, would have met a lower price and a more sceptical audience, because the flow figures that followed it would not yet have been there to confirm it.
The second is when the policy rate was raised. The decision fell in mid-September, which meant the quarter contained both the tightening and the repricing of the path after it. A decision taken in July would have produced a different sequence: the market would have had two months to adjust to the increase before the data that softened expectations arrived, and the quarter’s return would have been built from a different starting point.
The third is the timing inside the flow months. July contributed almost nothing, August carried the quarter, and September gave back a quarter of August. Had August’s three and a half billion arrived in July instead, the quarter would have had time to be questioned, and the narrative that formed around a reversal in the middle of a quarter would have had to survive two more months of data. Timing is not a footnote to a reconciliation; in this quarter it was one of the four variables.
How the same method applies to the next consensus
The exercise has a forward use, and it is narrower than a forecast. The current expectations in this market can be written down in the same format as the ones above — a policy decision at the end of October, a flow series expected to continue positive, a queue of staked assets expected to drain slowly — and each can be tagged with the reason it exists.
Tagged that way, the tags are informative. The policy expectation exists because the recent data weakened the case for tightening, which makes it an extrapolation of the last six weeks. The flow expectation exists because the flows have been positive for a month, which makes it an extrapolation of the last four weeks. The queue expectation exists because queues have historically drained without incident, which makes it an extrapolation of a small number of previous episodes in a different market regime.
All three may be correct. The point of writing them down with their reasons attached is that it identifies which one will be revised fastest if the data turns: an expectation built on six weeks of evidence breaks before one built on a decade, and that ordering is what a reconciliation of the next quarter will describe. It is also the reason the account above is worth keeping: the errors in it were not random, and the mechanism that produced them has not changed.
The point of the exercise
A quarter that rose more than forty percent while the consensus was cautious is not evidence that forecasts are worthless. It is evidence that forecasts describe the recent past, and that the useful part of any review is the difference between the projection and the print. Three of the four lines in this account were wrong in the same direction, which is the signature of a turning point rather than of a bad analyst.
The habit worth keeping is short. Before accepting any quarterly narrative, write down what was expected at the start, then write down what happened, then mark which lines moved and why the market cared about the ones it did. The mismatches between those two lists are the only part of the exercise that carries information forward, and they are precisely the part that a well-told story about institutional demand leaves out.


